PROVISIONAL DATA SUBJECT TO REVISION
Click to hidestation-specific text
Funding for this site is provided by:
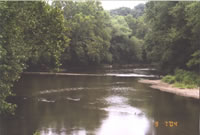 STATION.--01573825 WEST CONEWAGO CREEK AT EAST
BERLIN, PA
STATION.--01573825 WEST CONEWAGO CREEK AT EAST
BERLIN, PALOCATION.--Lat 39`56'28.4", long 76`59'24", Adams County, Hydrologic Unit 02050306, on right bank 30 ft downstream from bridge on State Highway 234, 1.4 mi upstream from confluence with Beaver Creek, at East Berlin.
DRAINAGE AREA.--218 square miles.
PERIOD OF RECORD.--September 2003 to current year.
GAGE.--Water-stage recorder and crest-stage gage and concrete control. Datum of gage is 400 ft above National Geodetic Vertical Datum of 1929, from topographic map.
COOPERATION.--Funding for the operation of this station is provided by the Pennsylvania Department of Environmental Protection.
REMARKS.--Satellite telemetry at station. Regulations and diversions are Conewago Creek on Beaver Creek.
GAGE HEIGHTS OF IMPORTANCE.-
Supplied by USGS: Data transmitter operational limit - 19.9 ft;
Supplied by NWS: No flood stage has been determined for this station.
Summary of all available data for this site
Instantaneous-data availability statement

