USGS 04213152 Walnut Creek Upstream Pool, near Erie, PA

PROVISIONAL DATA SUBJECT TO REVISION

Click to hidestation-specific text


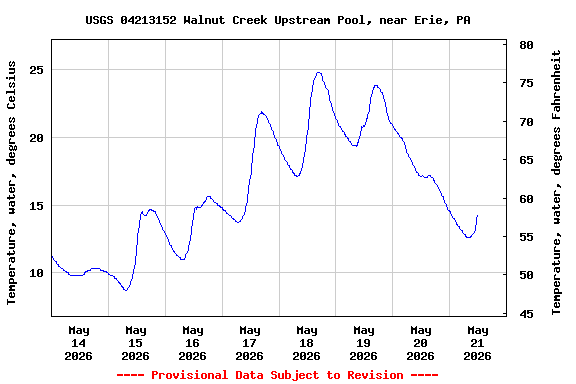
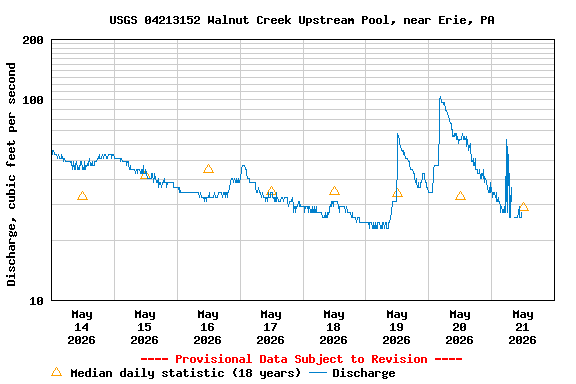
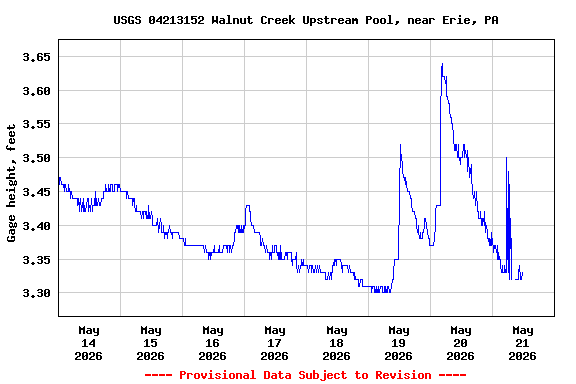
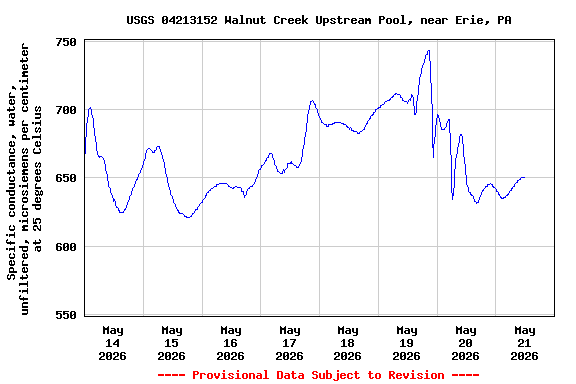
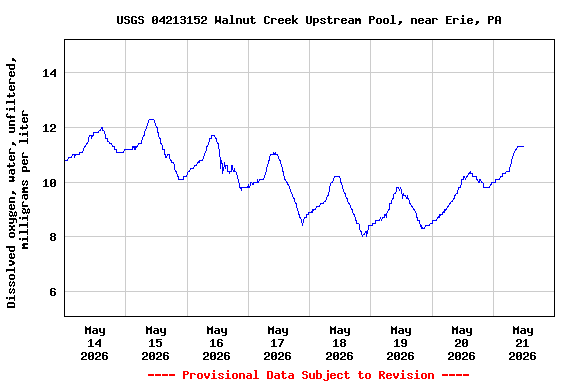
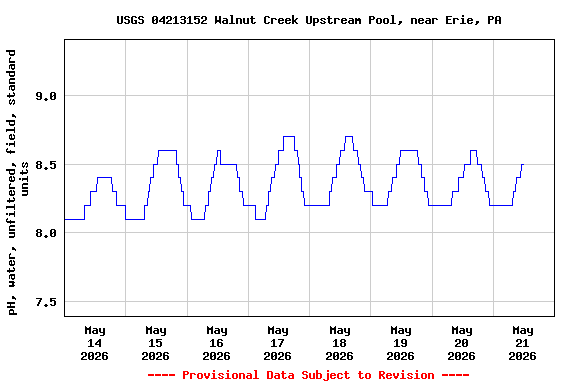
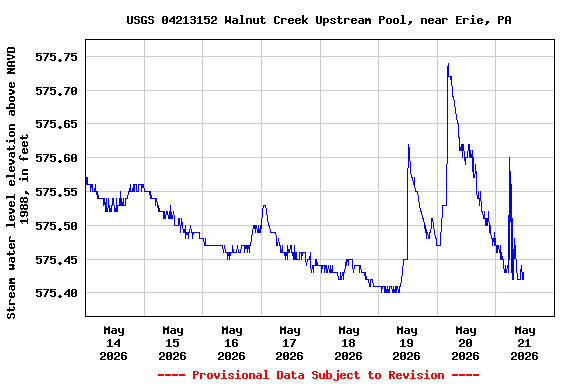
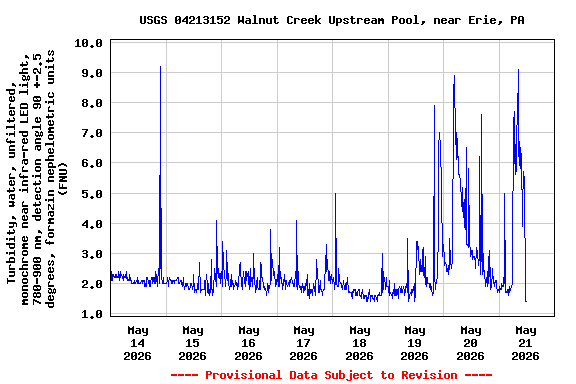
STATION.--04213152 WALNUT CREEK UPSTREAM POOL, NEAR ERIE, PA
LOCATION.--Lat 42`04'26", long 80`14'05", Erie County, Hydrologic Unit 04120101, on right bank, about 150 ft downstream of the Manchester Road bridge along the Pennsylvania Fish and Boat Commission access road.
DRAINAGE AREA.--37.3 square miles.
PERIOD OF RECORD.--April 2008 to current year.
GAGE.--Water-stage recorder. Datum of gage is 572.1 ft above North American Vertical Datum of 1988. Prior to February 14, 2024, the datum of gage was erroneously reported as 600 ft above National Geodetic Vertical Datum of 1929. Satellite telemetry at station.
COOPERATION.--Funding for the operation of this station is provided by the Pennsylvania Department of Environmental Protection.
REMARKS.-- Water quality measurements are suspended November through March.
This station managed by the PAWSC Pittsburgh Field Office.

Available Parameters Available Period
  
2010-10-01  2024-04-19
2008-04-01  2024-04-19
2008-03-27  2024-04-19
2010-10-01  2024-04-19
2010-10-01  2024-04-19
2010-10-01  2024-04-19
2021-10-01  2024-04-19
2010-10-01  2024-04-19


 (7)
 

  -- or --


Summary of all available data for this site
Instantaneous-data availability statement


Temperature, water, degrees Celsius

Most recent instantaneous value: 11.0 04-19-2024   07:45 EDT
Graph of  Temperature, water, degrees Celsius

Add up to 2 more sites and replot for "Temperature, water, degrees Celsius"

?


Create presentation-quality / stand-alone graph.   Subscribe to WaterAlert      

See this graph on the Monitoring Location Pages


Discharge, cubic feet per second

Most recent instantaneous value: 56.1 04-19-2024   07:30 EDT
Graph of  Discharge, cubic feet per second

Add up to 2 more sites and replot for "Discharge, cubic feet per second"

?


Create presentation-quality / stand-alone graph.   Subscribe to WaterAlert      

See this graph on the Monitoring Location Pages


Daily discharge, cubic feet per second -- statistics for Apr 19 based on 16 water years of record more
Min
(2012)
25th
percen-
tile
Median Most Recent
Instantaneous
Value Apr 19
Mean 75th
percen-
tile
Max
(2017)
16.0 29 49 56.1 60 75 169


Gage height, feet

Most recent instantaneous value: 3.37 04-19-2024   07:30 EDT
Graph of  Gage height, feet

Add up to 2 more sites and replot for "Gage height, feet"

?


Create presentation-quality / stand-alone graph.   Subscribe to WaterAlert      

See this graph on the Monitoring Location Pages


Specific conductance, water, unfiltered, microsiemens per centimeter at 25 degrees Celsius

Most recent instantaneous value: 552 04-19-2024   07:45 EDT
Graph of  Specific conductance, water, unfiltered, microsiemens per centimeter at 25 degrees Celsius

Add up to 2 more sites and replot for "Specific conductance, water, unfiltered, microsiemens per centimeter at 25 degrees Celsius"

?


Create presentation-quality / stand-alone graph.   Subscribe to WaterAlert      

See this graph on the Monitoring Location Pages


Dissolved oxygen, water, unfiltered, milligrams per liter

Most recent instantaneous value: 10.9 04-19-2024   07:45 EDT
Graph of  Dissolved oxygen, water, unfiltered, milligrams per liter

Add up to 2 more sites and replot for "Dissolved oxygen, water, unfiltered, milligrams per liter"

?


Create presentation-quality / stand-alone graph.   Subscribe to WaterAlert      

See this graph on the Monitoring Location Pages


pH, water, unfiltered, field, standard units

Most recent instantaneous value: 8.1 04-19-2024   07:45 EDT
Graph of  pH, water, unfiltered, field, standard units

Add up to 2 more sites and replot for "pH, water, unfiltered, field, standard units"

?


Create presentation-quality / stand-alone graph.   Subscribe to WaterAlert      

See this graph on the Monitoring Location Pages


Stream water level elevation above NAVD 1988, in feet

Most recent instantaneous value: 575.47 04-19-2024   07:30 EDT
Graph of  Stream water level elevation above NAVD 1988, in feet

Add up to 2 more sites and replot for "Stream water level elevation above NAVD 1988, in feet"

?


Create presentation-quality / stand-alone graph.   Subscribe to WaterAlert      

See this graph on the Monitoring Location Pages


Turbidity, water, unfiltered, monochrome near infra-red LED light, 780-900 nm, detection angle 90 +-2.5 degrees, formazin nephelometric units (FNU)

Most recent instantaneous value: 3.2 04-19-2024   07:45 EDT
Graph of  Turbidity, water, unfiltered, monochrome near infra-red LED light, 780-900 nm, detection angle 90 +-2.5 degrees, formazin nephelometric units (FNU)

Add up to 2 more sites and replot for "Turbidity, water, unfiltered, monochrome near infra-red LED light, 780-900 nm, detection angle 90 +-2.5 degrees, formazin nephelometric units (FNU)"

?


Create presentation-quality / stand-alone graph.   Subscribe to WaterAlert      

See this graph on the Monitoring Location Pages