PROVISIONAL DATA SUBJECT TO REVISION
Click to hidestation-specific text
Funding for this site is provided by:
 STATION.--402615075530501 BERKS COUNTY, local well
number BE623
STATION.--402615075530501 BERKS COUNTY, local well
number BE623LOCATION.--Lat 40`26'14.9", long 75`53'03.3", Hydrologic Unit 02040203, at Wesner Road, Blandon.
OWNER.--Maiden Creek Township Water Authority.
AQUIFER.--Dolomite of Leithsville Formation of Early and Middle Cambrian age.
WELL CHARACTERISTICS.--Drilled unused well, diameter 8 in. Well depth was reported as 385 ft in 1975; borehole video on August 11, 2015 found the depth was 318 ft; cased to 132 ft, open hole..
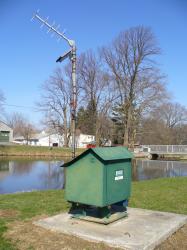
INSTRUMENTATION.--Data collection platform with 30-minute recording interval. Satellite telemetry at station.
DATUM.--Elevation of land-surface datum is 434 ft above North American Vertical Datum of 1988, from Lidar. Measuring point: Top of plywood shelf, 1.69 ft above land-surface datum. Prior to Apr. 30, 1981, top of casing, 1.30 ft above land-surface datum.
REMARKS.--Daily maximum, minimum, and mean water levels since October 1994, are available from the District Office.
PERIOD OF RECORD.--January 1975 to current year.
COOPERATION.--Funding for the operation of this station is provided by the Pennsylvania Department of Environmental Protection and the U.S. Geological Survey.
Summary of all available data for this site
Instantaneous-data availability statement
