PROVISIONAL DATA SUBJECT TO REVISION
Click to hidestation-specific text
Funding for this site is provided by:

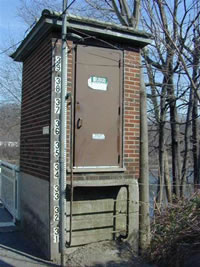 STATION.--01567000 JUNIATA RIVER AT NEWPORT, PA
LOCATION.--Lat 40`28'42", long 77`07'46", Perry County, Hydrologic Unit 02050304, on right bank at downstream side of bridge on State Highway 34 at Newport and 1,000 ft upstream from Little Buffalo Creek.
DRAINAGE AREA.--3,354 square miles.
PERIOD OF RECORD.--April 1899 to current year. Water-quality 1944 to 1993 and 2008 to March 2015.
GAGE.--Water-stage recorder and crest-stage gage. Datum of gage is 363.93 ft above National Geodetic Vertical Datum of 1929. Prior to July 16, 1929, non-recording gage at same site and datum.
COOPERATION.--Station established and maintained by the U.S. Geological Survey. Funding for the operation of this station is provided by the U.S. Geological Survey.
REMARKS.--Flow regulated since Oct 1972 by Raystown Dam (station 01563100) about 75 mi upstream. Since June 1969, water diverted upstream from station for municipal supply.
GAGE HEIGHTS OF IMPORTANCE.-
Supplied by USGS: Data transmitter operational limit - 37.2 ft;
Supplied by NWS: Action stage-17 ft; Flood stage-22 ft, backwater from tributary streams affects basements of a number of homes; Moderate flood stage-25 ft, the left, or north bank overflows; first floor floods of several homes in low lying areas; Major flood stage-30 ft, the right, or south bank overflows; streets begin to be affected by high water; most of business district and a large residential area are affected.
Summary of all available data for this site
Instantaneous-data availability statement


