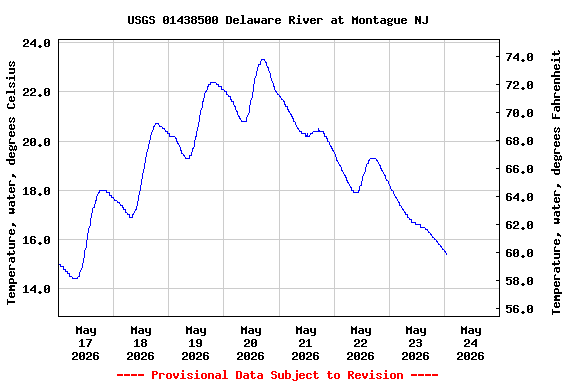
Most recent instantaneous value: 15.4 05-24-2026 00:45 EDT
See this graph on the Monitoring Location Pages
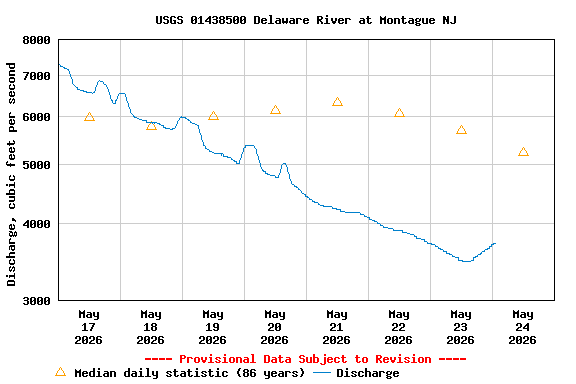
| Min (1965) | 25th percen- tile | Most Recent Instantaneous Value May 24 | Median | Mean | 75th percen- tile | Max (1942) |
|---|---|---|---|---|---|---|
| 1420 | 3060 | 3720 | 5230 | 7020 | 8330 | 61800 |
![]() U.S. Department of the Interior |
U.S. Geological Survey
U.S. Department of the Interior |
U.S. Geological Survey
Title: USGS Current Conditions for Pennsylvania
URL:
Page Contact Information: New Jersey Water Data Support Team
Page Last Modified: 2026-05-24 01:37:40 EDT
3.98 2.76 caww02