USGS 01440400 Brodhead Creek near Analomink, PA

PROVISIONAL DATA SUBJECT TO REVISION

Click to hidestation-specific text


Station gage image
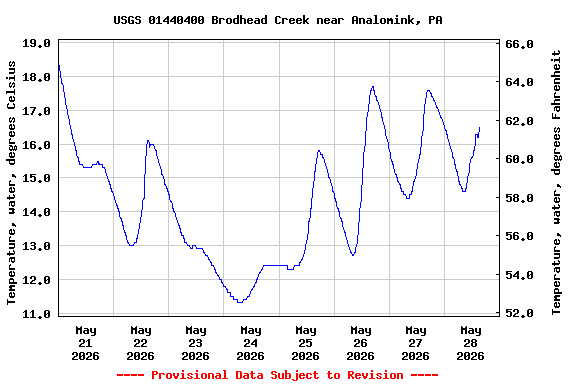
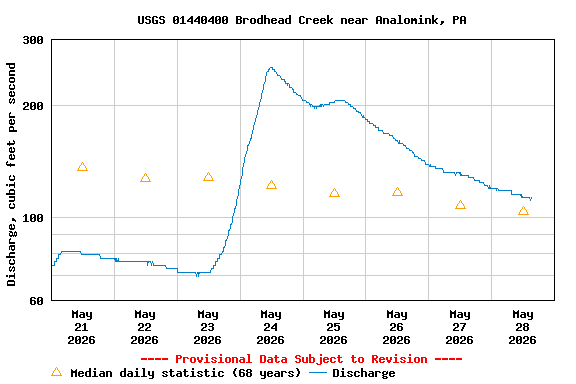
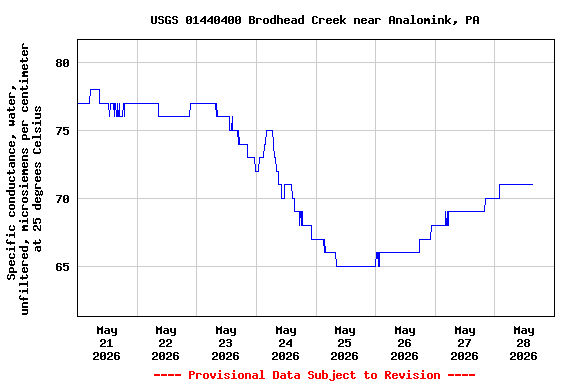
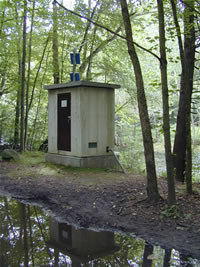
STATION.--01440400 BRODHEAD CREEK NEAR ANALOMINK, PA
LOCATION.--Lat 41`05'05", long 75`12'54", Monroe County, Hydrologic Unit 02040104, on left bank 1.5 mi upstream from Paradise Creek, 1.6 mi southeast of Henryville, and 2.3 mi north of Analomink.
DRAINAGE AREA.--65.9 square miles.
PERIOD OF RECORD.--October 1957 to current year.
GAGE.--Water-stage recorder and crest-stage gage. Datum of gage is 586.50 ft above the National Geodetic Vertical Datum of 1929. Prior to Dec. 12, 1957, non-recording gage at same site and datum. Satellite telemetry at station.
COOPERATION.--Funding for the operation of this station is provided by the Pennsylvania Department of Environmental Protection and the U.S. Geological Survey.
GAGE HEIGHTS OF IMPORTANCE.-
Supplied by USGS: Data transmitter operational limit - 16.3 ft;
Supplied by NWS: Action stage-7 ft; Flood stage-8 ft; Moderate flood stage-9 ft; Major flood stage-11 ft;
This station managed by the PAWSC Williamsport Field Office.

Available Parameters Available Period
  
2019-11-20  2024-03-18
1990-10-01  2024-03-18
2007-10-01  2024-03-18
2019-11-20  2024-03-18
2021-11-01  2024-03-18


 (7)
 

  -- or --


Summary of all available data for this site
Instantaneous-data availability statement
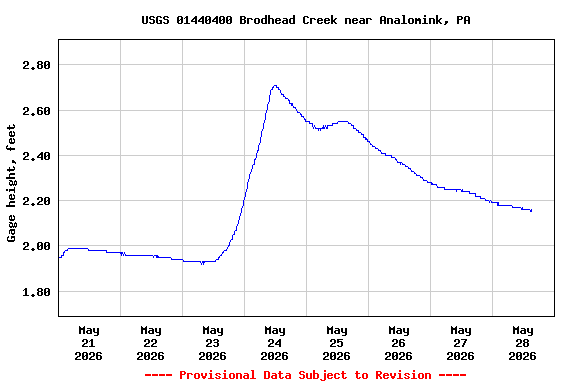

Temperature, water, degrees Celsius

Most recent instantaneous value: 6.3 03-18-2024   22:15 EDT
Graph of  Temperature, water, degrees Celsius

Add up to 2 more sites and replot for "Temperature, water, degrees Celsius"

?


Create presentation-quality / stand-alone graph.   Subscribe to WaterAlert      

See this graph on the Monitoring Location Pages


Discharge, cubic feet per second

Most recent instantaneous value: 171 03-18-2024   22:15 EDT
Graph of

Add up to 2 more sites and replot for "Discharge, cubic feet per second"

?


Create presentation-quality / stand-alone graph.   Subscribe to WaterAlert      

See this graph on the Monitoring Location Pages


Daily discharge, cubic feet per second -- statistics for Mar 18 based on 66 water years of record more
Min
(1969)
25th
percen-
tile
Most Recent
Instantaneous
Value Mar 18
Median Mean 75th
percen-
tile
Max
(2003)
58.0 122 171 207 235 308 672


Gage height, feet

Most recent instantaneous value: 2.45 03-18-2024   22:15 EDT
Graph of  Gage height, feet

Add up to 2 more sites and replot for "Gage height, feet"

?


Create presentation-quality / stand-alone graph.   Subscribe to WaterAlert      

See this graph on the Monitoring Location Pages


Specific conductance, water, unfiltered, microsiemens per centimeter at 25 degrees Celsius

Most recent instantaneous value: 56 03-18-2024   22:15 EDT
Graph of  Specific conductance, water, unfiltered, microsiemens per centimeter at 25 degrees Celsius

Add up to 2 more sites and replot for "Specific conductance, water, unfiltered, microsiemens per centimeter at 25 degrees Celsius"

?


Create presentation-quality / stand-alone graph.   Subscribe to WaterAlert      

See this graph on the Monitoring Location Pages


Stream water level elevation above NAVD 1988, in feet, [Gage Height above NAVD 88]

Most recent instantaneous value: 588.23 03-18-2024   22:15 EDT
Graph of  Stream water level elevation above NAVD 1988, in feet, [Gage Height above NAVD 88]

Add up to 2 more sites and replot for "Stream water level elevation above NAVD 1988, in feet, [Gage Height above NAVD 88]"

?


Create presentation-quality / stand-alone graph.   Subscribe to WaterAlert      

See this graph on the Monitoring Location Pages