USGS 01447680 Tunkhannock Creek near Long Pond, PA

PROVISIONAL DATA SUBJECT TO REVISION

Click to hidestation-specific text
Funding for this site is provided by:


Station gage imageSTATION.--01447680 TUNKHANNOCK CREEK NEAR LONG POND, PA
LOCATION.--Lat 41`03'55", long 75`31'17", Monroe County, Hydrologic Unit 02040106, on left bank 0.6 mi downstream from unnamed tributary, 0.9 mi downstream from bridge on SR 4002, 3.0 mi west of Long Pond, and 5.0 mi upstream from mouth.
DRAINAGE AREA.--18.0 square miles. At site used prior to July 7, 1966, 16.8 square miles.
PERIOD OF RECORD.--March 1965 to current year.
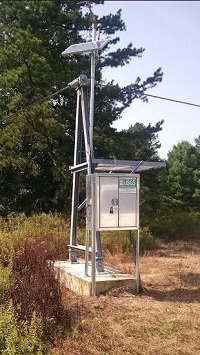
GAGE.--Water-stage recorder and crest-stage gage. Datum of gage is 1804.23 ft above North American Vertical Datum of 1988 from benchmark. Prior to July 7, 1966, non-recording gage at site 0.8 mi upstream at different datum. Prior to June 24, 2024, the datum of gage was reported as 1,804.83 ft above National Geodetic Vertical Datum of 1929. Satellite telemetry at station.
COOPERATION.--Records of diversion provided by the City of Bethlehem. Station established and maintained by the U.S. Geological Survey. Funding for the operation of this station is provided by the City of Bethlehem and the U.S. Geological Survey.
GAGE HEIGHTS OF IMPORTANCE.-
Supplied by USGS: Maximum recordable gage height (stage sensor operational limit) - 9.5 ft; Data transmitter operational limit - 10.9 ft;
Supplied by NWS: No flood stage has been determined for this station.
This station managed by the PAWSC Williamsport Field Office.

Available Parameters Available Period
  
1990-10-01  2024-07-27
2007-10-01  2024-07-27
2021-10-01  2024-07-27


 (7)
 

  -- or --


Summary of all available data for this site
Instantaneous-data availability statement


Discharge, cubic feet per second

Most recent instantaneous value: 17.4 07-27-2024   01:30 EDT
Graph of  Discharge, cubic feet per second

Add up to 2 more sites and replot for "Discharge, cubic feet per second"

?


Create presentation-quality / stand-alone graph.   Subscribe to WaterAlert      

See this graph on the Monitoring Location Pages


Daily discharge, cubic feet per second -- statistics for Jul 27 based on 54 water years of record more
Min
(1999)
25th
percen-
tile
Most Recent
Instantaneous
Value Jul 27
Median Mean 75th
percen-
tile
Max
(2018)
2.50 13 17.4 19 29 34 319


Gage height, feet

Most recent instantaneous value: 1.41 07-27-2024   01:30 EDT
Graph of  Gage height, feet

Add up to 2 more sites and replot for "Gage height, feet"

?


Create presentation-quality / stand-alone graph.   Subscribe to WaterAlert      

See this graph on the Monitoring Location Pages


Stream water level elevation above NAVD 1988, in feet

Most recent instantaneous value: 1805.64 07-27-2024   01:30 EDT
Graph of  Stream water level elevation above NAVD 1988, in feet

Add up to 2 more sites and replot for "Stream water level elevation above NAVD 1988, in feet"

?


Create presentation-quality / stand-alone graph.   Subscribe to WaterAlert      

See this graph on the Monitoring Location Pages