USGS 03012550 Allegheny River at Kinzua Dam, PA

PROVISIONAL DATA SUBJECT TO REVISION

Click to hidestation-specific text
Funding for this site is provided by:


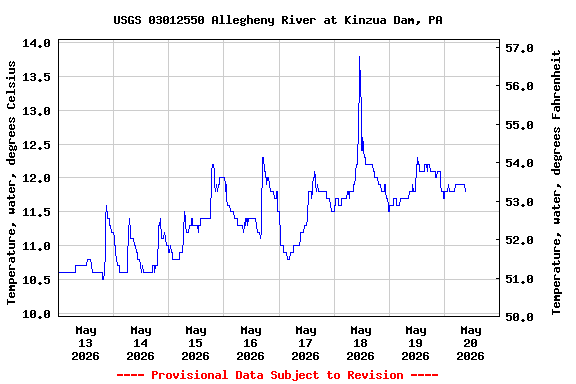
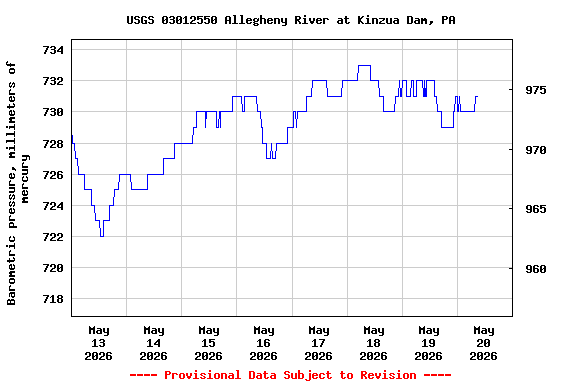
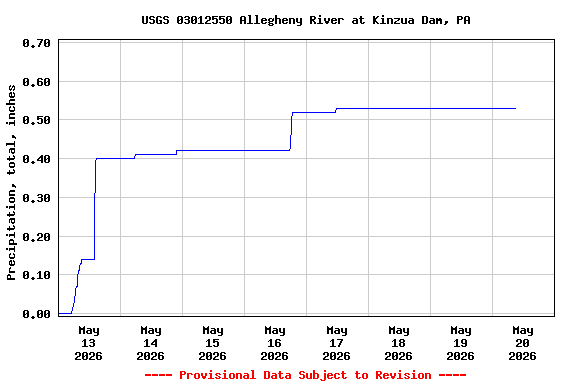
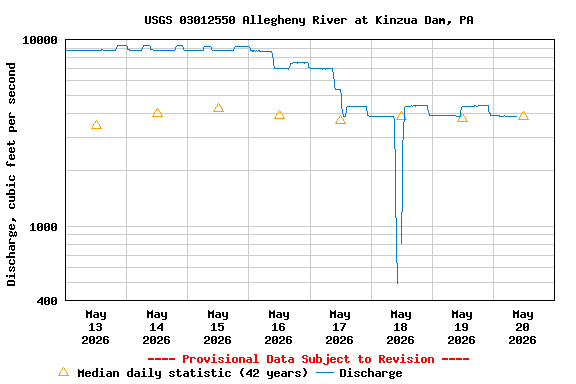
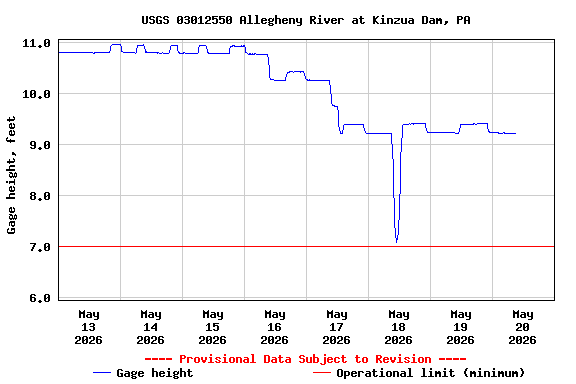
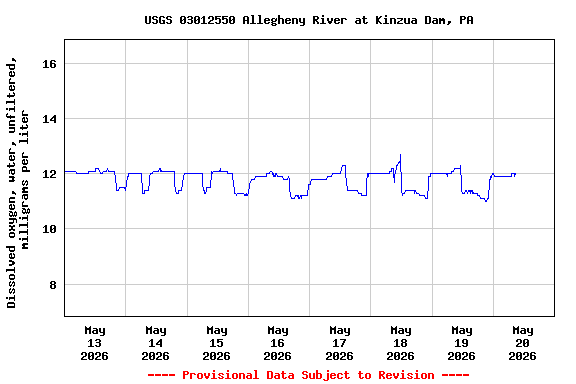
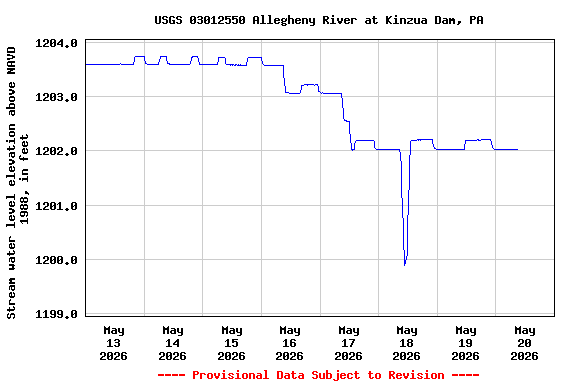
STATION.--03012550 ALLEGHENY RIVER AT KINZUA DAM, PA
LOCATION.--Lat 41`50'29", long 79`00'44", Warren County, Hydrologic Unit 05010001.
DRAINAGE AREA.--2,180 square miles.
PERIOD OF RECORD.--1936-91, 2005-2009 (discharge measurements only), 2010 to current year. Published as "near Kinzua" (Station 03012500) prior to October 1968, and as "at Warren" (Station 03012600) October 1968 to September 1972.
GAGE.--Water-stage recorder and heated tipping bucket precipitation gage. Elevation of gage is 1,192.8 ft above North American Vertical Datum of 1988. Prior to April 4, 2023, the datum of gage was erroneously reported as 1,192.55 ft above National Geodetic Vertical Datum of 1929.
COOPERATION.--Station established and maintained by the U.S. Geological Survey. Funding for the operation of this station is provided by the U.S. Army Corps of Engineers, Pittsburgh District.
REMARKS.--Flow regulated since October 1965 by Allegheny Reservoir (station 03012520), 0.5 mile upstream.Satellite telemetery at station.
The 1-hour precipitation data for this station are temporary and will only be displayed for 120 days. Time series of 1-hour or cumulative daily values will NOT be available for retrieval following the 120-day display period. Although the instrumentation is calibrated at least once a year, the temporary classification means that documented routine inspections and other quality assurance measures are not performed that would make the data acceptable for archival, retrieval, or future use in general scientific or interpretive studies.
This station managed by the PAWSC Pittsburgh Field Office.

Available Parameters Available Period
  
2021-07-27  2024-07-27
2024-04-30  2024-07-27
2024-03-29  2024-07-27
2009-10-01  2024-07-27
2009-10-01  2024-07-27
2024-04-30  2024-07-27
2024-04-30  2024-07-27
2022-01-01  2024-07-27


 (7)
 

  -- or --


Summary of all available data for this site
Instantaneous-data availability statement


Temperature, water, degrees Celsius

Most recent instantaneous value: 22.3 07-27-2024   06:00 EDT
Graph of  Temperature, water, degrees Celsius

Add up to 2 more sites and replot for "Temperature, water, degrees Celsius"

?


Create presentation-quality / stand-alone graph.   Subscribe to WaterAlert      

See this graph on the Monitoring Location Pages


Barometric pressure, millimeters of mercury, DO Sat

Most recent instantaneous value: 735 07-27-2024   05:45 EDT
Graph of  Barometric pressure, millimeters of mercury

Add up to 2 more sites and replot for "Barometric pressure, millimeters of mercury, DO Sat"

?


Create presentation-quality / stand-alone graph.   Subscribe to WaterAlert      

See this graph on the Monitoring Location Pages


Precipitation, total, inches

Most recent instantaneous value: 0.00 07-27-2024   06:00 EDT
Graph of  Precipitation, total, inches

Add up to 2 more sites and replot for "Precipitation, total, inches"

?


Create presentation-quality / stand-alone graph.   Subscribe to WaterAlert      

See this graph on the Monitoring Location Pages


Discharge, cubic feet per second

Most recent instantaneous value: 2190 07-27-2024   06:00 EDT
Graph of  Discharge, cubic feet per second

Add up to 2 more sites and replot for "Discharge, cubic feet per second"

?


Create presentation-quality / stand-alone graph.   Subscribe to WaterAlert      

See this graph on the Monitoring Location Pages


Daily discharge, cubic feet per second -- statistics for Jul 27 based on 40 water years of record more
Min
(1966)
25th
percen-
tile
Median Mean 75th
percen-
tile
Most Recent
Instantaneous
Value Jul 27
Max
(2021)
205 1190 1460 1760 1830 2190 8800


Gage height, feet

Most recent instantaneous value: 8.49 07-27-2024   06:00 EDT
Graph of  Gage height, feet

Add up to 2 more sites and replot for "Gage height, feet"

?


Create presentation-quality / stand-alone graph.   Subscribe to WaterAlert      

See this graph on the Monitoring Location Pages


Dissolved oxygen, water, unfiltered, milligrams per liter

Most recent instantaneous value: 9.8 07-27-2024   05:45 EDT
Graph of  Dissolved oxygen, water, unfiltered, milligrams per liter

Add up to 2 more sites and replot for "Dissolved oxygen, water, unfiltered, milligrams per liter"

?


Create presentation-quality / stand-alone graph.   Subscribe to WaterAlert      

See this graph on the Monitoring Location Pages


Dissolved oxygen, water, unfiltered, percent of saturation, DO Sat

Most recent instantaneous value: 116 07-27-2024   05:45 EDT
Graph of  Dissolved oxygen, water, unfiltered, percent of saturation

Add up to 2 more sites and replot for "Dissolved oxygen, water, unfiltered, percent of saturation, DO Sat"

?


Create presentation-quality / stand-alone graph.   Subscribe to WaterAlert      

See this graph on the Monitoring Location Pages


Stream water level elevation above NAVD 1988, in feet

Most recent instantaneous value: 1201.29 07-27-2024   06:00 EDT
Graph of  Stream water level elevation above NAVD 1988, in feet

Add up to 2 more sites and replot for "Stream water level elevation above NAVD 1988, in feet"

?


Create presentation-quality / stand-alone graph.   Subscribe to WaterAlert      

See this graph on the Monitoring Location Pages