USGS 50095000 CANAL DE GUAMANI OESTE AT HWY 15 GUAYAMA, PR
PROVISIONAL DATA SUBJECT TO REVISION
Available data for this site
SUMMARY OF ALL AVAILABLE DATA
Time-series: Current/Historical Observations
Time-series: Daily data
Time-series: Daily statistics
Time-series: Monthly statistics
Time-series: Annual statistics
Surface-water: Field measurements
Water-Year Summary
Revisions
Click to hide
station-specific text
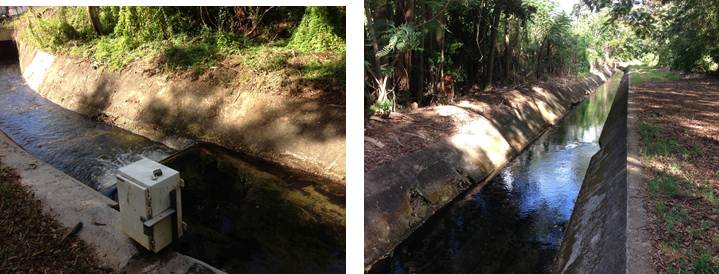
Photos by USGS, Caribbean-Florida Water Science Center Hydrologic Technicians - San Juan.
This station managed by the Caribbean-Florida WSC - San Juan.
Available Parameters
Available Period
All 3 Available Parameters for this site
00045 Precipitation
2018-06-05
2022-10-24
00060 Discharge
2005-12-29
2025-12-10
00065 Gage height
2007-10-01
2025-12-10
Output format
Graph
Graph w/ stats
Graph w/o stats
Graph w/ (up to 3) parms
Table
Tab-separated
Days
(7)
-- or --
Begin date
End date
Summary of all available data for this site
Instantaneous-data availability statement
Discharge, cubic feet per second
Most recent instantaneous value: 2.08 12-10-2025 02:15 AST
Add up to 2 more sites and replot for "Discharge, cubic feet per second"
?
Add site numbers
Note
'Enter up to 2 site numbers separated by a comma. A site number consists of 8 to 15 digits'
Create
presentation-quality
/
stand-alone
graph. Subscribe to
?
WaterAlert
See this graph on the
Monitoring Location Pages
Share this graph
|
Daily discharge, cubic feet per second -- statistics for Dec 10 based on 10 water years of record
more
Most Recent
Instantaneous
Value Dec 10
Min
(2017)
25th
percen-
tile
Median
Mean
75th
percen-
tile
Max
(2024)
2.08
2.66
3.8
4.7
4.9
6.3
6.55