PROVISIONAL DATA SUBJECT TO REVISION
Click to hidestation-specific text
 |
|
|
|
|
|
Station Drainage Area
|
|
|
|
|
 |
|
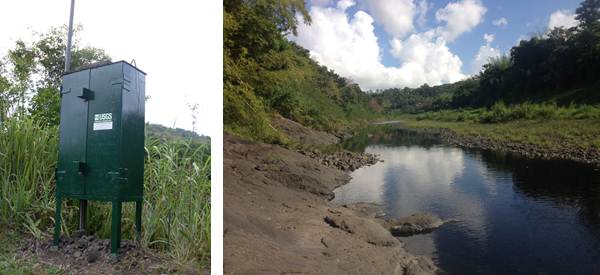
| Photos by USGS, Caribbean-Florida Water Science Center Hydrologic Technicians - San Juan. | |
Summary of all available data for this site
Instantaneous-data availability statement
![[JPEG, 5,868 KB]](https://pr.water.usgs.gov/data/gis/drainage/DA_50059050_lttr.jpg)