PROVISIONAL DATA SUBJECT TO REVISION
Click to hidestation-specific text
 Site Information
LOCATION.--Lat 41°45'24.3", long
75°03'26.7" referenced to North American Datum of
1983, Wayne County, PA, Hydrologic Unit 02040101, on right bank
0.5 mi downstream from Callicoon Creek, 0.5 mi downstream from
Interstate Bridge 7, and 0.8 mi southeast of Callicoon.
DRAINAGE AREA.--1,820 mi².
PERIOD OF RECORD.--June 1975 to current year.
REVISIONS HISTORY.--WDR NY-82-1: Drainage area. WDR NY-86-1: 1975-84 (M). WDR NY-04-1: 2003.
GAGE.--Water-stage recorder and crest-stage gage. Datum of gage is 734.88 ft above NGVD of 1929 and 734.33 ft above NAVD of 1988.
REMARKS.--Entire flow from 371 mi² of drainage area controlled by Pepacton Reservoir (station 01416900), and entire flow from 454 mi² of drainage area controlled by Cannonsville Reservoir (station 01424997). Part of flow from these reservoirs diverted for New York City municipal supply. Remainder of flow (except for conservation releases and spill) impounded for release during periods of low flow in the lower Delaware River basin, as directed by the Delaware River Master.
Water Years 2014-22: Records good except those for estimated daily discharges, which are poor.
EXTREMES FOR PERIOD OF RECORD.--Maximum discharge, 144,000 ft³/s, June 28, 2006, gage height, 20.38 ft; minimum discharge, 306 ft³/s, Sept. 24, 25, 1997; minimum gage height, 2.20 ft, Sept. 13, 1977, Aug. 23, 1985.
PERIOD OF DAILY RECORD1.--SPECIFIC CONDUCTANCE: June 2012 to March 2014, December 2014 to current year. WATER TEMPERATURE: June 1975 to current year. pH: December 2019 to current year. DISSOLVED OXYGEN: December 2019 to current year. CHLOROPHYLL FLUORESCENCE: December 2019 to current year. PHYCOCYANIN FLUORESCENCE: December 2019 to current year.
INSTRUMENTATION1.--A continuous water-quality monitor with water temperature, specific conductance, pH, dissolved oxygen, chlorophyll fluorescence, and phycocyanin fluorescence provides 15-minute-interval readings. Prior to May 1989, water-temperature recorder provided one-hour-interval readings.
REMARKS1.--Temperature readings prior to Oct. 1, 2007, rounded to the nearest 0.5 °C. Water temperature is affected by release of water from upstream reservoirs. Specific conductance records considered poor in water years 2015-17, 2019.
EXTREMES FOR PERIOD OF DAILY RECORD1.--WATER TEMPERATURE: Prior to Oct. 1, 2007--Maximum, 30.5°C, July 12, 1987; minimum, 0.0°C, on many days during winter periods. After Oct. 1, 2007--Maximum, 30.4°C, July 7, 2010; minimum, -0.3°C Dec. 2, 2007, Dec. 3, 8, 19, 2019.
SPECIFIC CONDUCTANCE: Maximum, 252 uS/cm @ 25°C, July 5, 6, 2018; minimum, 28 uS/cm @ 25°C, Dec. 19, 2023.
pH: Maximum, 10.0, May 18, 19, 20, 21; minimum, 6.0, July 17, 2021, Apr. 9, 10, 16, 2022.
DISSOLVED OXYGEN: Maximum, 15.2 mg/L, Jan. 31, 2021, Jan. 22, 2022; minimum, 4.7 mg/L July 22, 2020.
CHLOROPHYLL FLUORESCENCE: Maximum, 108 ug/L, 26.9 RFU, May 2, 2020; minimum <0.0 ug/L, 0.0 RFU, on many days. [<, actual value is known to be less than the value shown].
PHYCOCYANIN FLUORESCENCE: Maximum, 28.57 ug/L, 28.66 RFU, Oct. 8, 2020; minimum, <0.0 ug/L, <0.0 RFU, on many days. [<, actual value is known to be less than the value shown].
1 Water-Quality Records
 WaterAlert – get an
email or text (SMS) alert based on your chosen threshold.
WaterAlert – get an
email or text (SMS) alert based on your chosen threshold.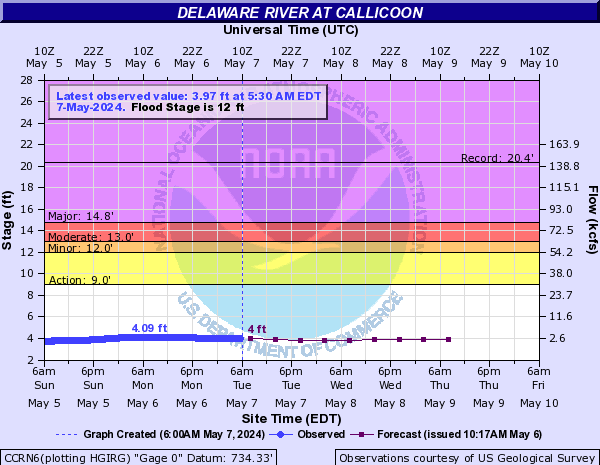
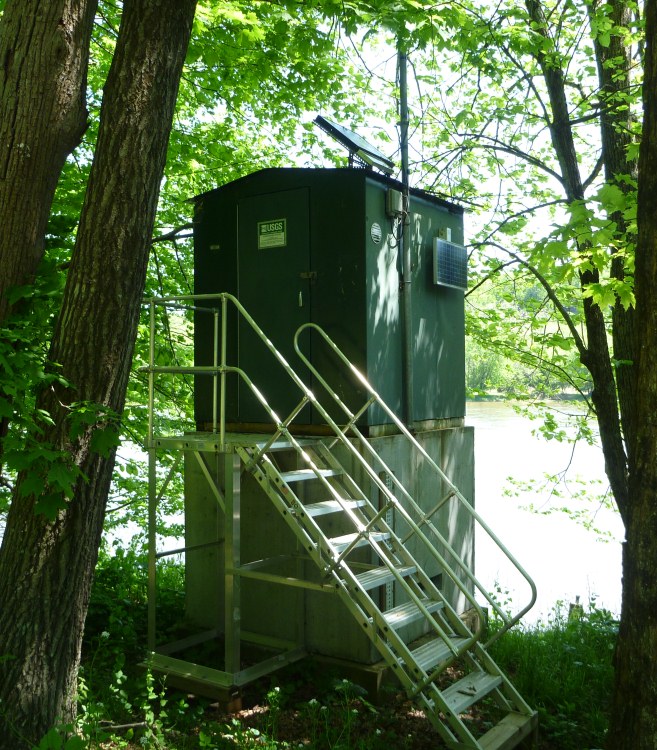 Station image
Summary of all available data for this site
Instantaneous-data availability statement


