PROVISIONAL DATA SUBJECT TO REVISION
Click to hidestation-specific text
Funding for this site is provided by:
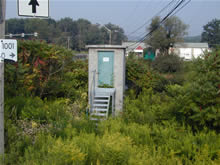 STATION.--01541303 WEST BRANCH SUSQUEHANNA RIVER AT
HYDE, PA
STATION.--01541303 WEST BRANCH SUSQUEHANNA RIVER AT
HYDE, PALOCATION.--Lat 41`00'16", long 78`27'25", Clearfield County, Hydrologic Unit 02050201, on right bank 60 ft downstream from bridge at intersection of SR 1001 and State Highway 879 at Hyde.
DRAINAGE AREA.--474 square miles.
PERIOD OF RECORD.--October 1978 to current year.
GAGE.--Water-stage recorder and crest-stage gage. Datum of gage is 1093.35 ft above North American Vertical Datum of 1988. Prior to September 1, 2023, the datum of gage was reported as 1093.90 ft above National Geodetic Vertical Datum of 1929. Satellite telemetry at station.
COOPERATION.--Funding for the operation of this station is provided by the U.S. Army Corps of Engineers, Baltimore District.
REMARKS.--Flow regulated since November 1965 by Curwensville Dam, about 5 mi upstream.
GAGE HEIGHTS OF IMPORTANCE.-
Supplied by USGS: Data transmitter operational limit - 24.1 ft;
Supplied by NWS: No flood stage has been determined for this station.
Summary of all available data for this site
Instantaneous-data availability statement


