USGS 01054000 Androscoggin River near Gorham, NH

PROVISIONAL DATA SUBJECT TO REVISION

Click to hidestation-specific text
USGS Maine Office celebrating over 100 years of streamgage record for this station.

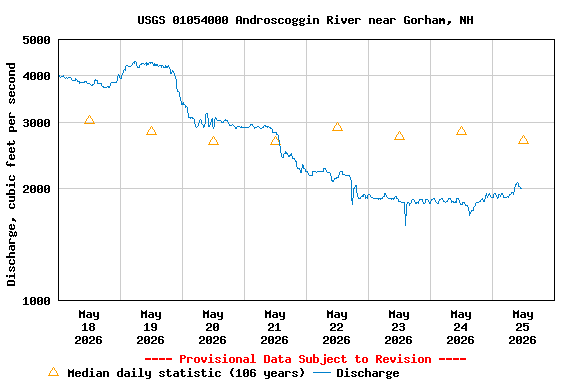
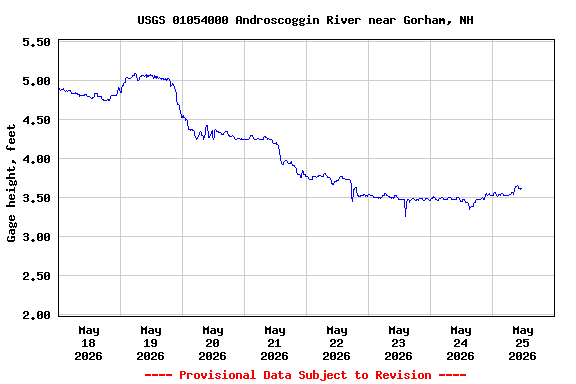
Station operated in cooperation with Brookfield Renewable.
Period of Record - Discharge: October 1913 to current year. October 1922 to September 1928, monthly discharge only, published in WSP 1301. Discharges for December 1917 not used in long-term statistics because of unknown discharge on Dec. 25, 1917. Prior to October 1928, published as "at Berlin."

The National Weather Service flood stage for this site is 8.0 ft. (Forecast)

Current shift-adjusted rating in tab-delimited format.
These are updated daily and can change often! If you use these ratings it is important that you update often so that you have the most current version.
What is a shift-adjusted rating?
This station managed by the Augusta ME Field Office.

Available Parameters Available Period
  
2025-12-19  2026-01-26
1990-10-01  2026-01-26
2007-10-01  2026-01-26


 (7)
 

  -- or --


Summary of all available data for this site
Instantaneous-data availability statement


Discharge, cubic feet per second

Most recent instantaneous value: Ice 01-26-2026   16:15 EST
Graph of  Discharge, cubic feet per second

Add up to 2 more sites and replot for "Discharge, cubic feet per second"

?


Create presentation-quality / stand-alone graph.   Subscribe to WaterAlert      

See this graph on the Monitoring Location Pages


Daily discharge, cubic feet per second -- statistics for Jan 26 based on 106 water years of record more
Most Recent
Instantaneous
Value Jan 26
Min
(1922)
25th
percen-
tile
Median Mean 75th
percen-
tile
Max
(2019)
-- unavailable -- 1330 1800 2180 2330 2740 4760


Discharge, cubic feet per second, [Estimated Winter Discharge 1]

Most recent instantaneous value: 2770 01-26-2026   16:45 EST
Graph of  Discharge, cubic feet per second, [Estimated Winter Discharge 1]

Add up to 2 more sites and replot for "Discharge, cubic feet per second, [Estimated Winter Discharge 1]"

?


Create presentation-quality / stand-alone graph.   Subscribe to WaterAlert      

See this graph on the Monitoring Location Pages


Gage height, feet

Most recent instantaneous value: 4.92 01-26-2026   16:15 EST
Graph of  Gage height, feet

Add up to 2 more sites and replot for "Gage height, feet"

?


Create presentation-quality / stand-alone graph.   Subscribe to WaterAlert      

See this graph on the Monitoring Location Pages