PROVISIONAL DATA SUBJECT TO REVISION
Click to hidestation-specific text
|
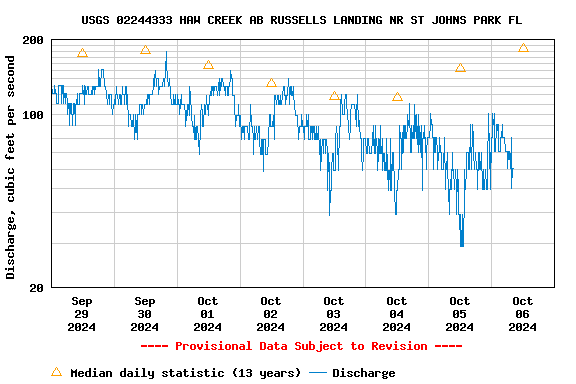
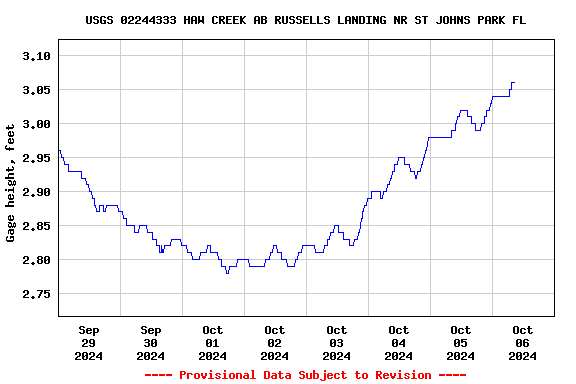
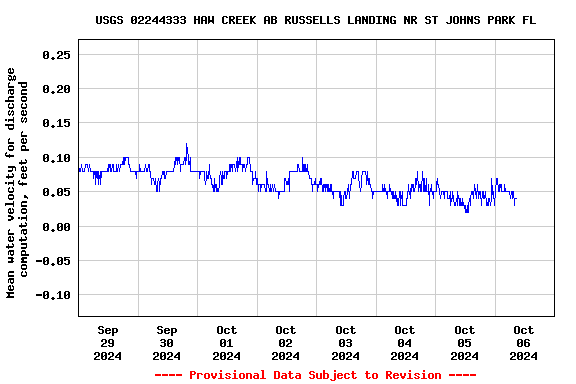
This gage is monitored in cooperation with the St. Johns River Water Management District.
|
- NWS Flood Forecast for location
- NWS Southeast River Forecast Center
REMARKS.--Computed discharge at this station may differ from individual measurements because of changes in tidal influence, wind, or other factors.
Instantaneous-data availability statement