USGS 02414500 TALLAPOOSA RIVER AT WADLEY AL

PROVISIONAL DATA SUBJECT TO REVISION

Click to hidestation-specific text
Flood of May 2003 on the Tallapoosa River

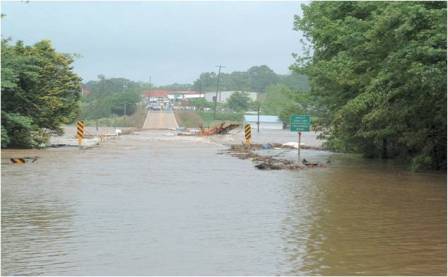
Photo courtesy of the Randolph County Emergency Management Agency

> WaterNow – get the latest gage data from your mobile phone or email.
> Rating Information
This station managed by the Montgomery Field Office.

Available Parameters Available Period
  
2018-02-13  2020-11-23
1994-10-01  2024-04-25
2007-10-01  2024-04-25
2021-05-13  2024-04-25


 (7)
 

  -- or --


Summary of all available data for this site
Instantaneous-data availability statement


Discharge, cubic feet per second

Most recent instantaneous value: 623 04-25-2024   18:00 CDT
Graph of

Add up to 2 more sites and replot for "Discharge, cubic feet per second"

?


Create presentation-quality / stand-alone graph.   Subscribe to WaterAlert      

See this graph on the Monitoring Location Pages


Daily discharge, cubic feet per second -- statistics for Apr 25 based on 40 water years of record more
Min
(1985)
25th
percen-
tile
Most Recent
Instantaneous
Value Apr 25
Median Mean 75th
percen-
tile
Max
(2003)
177 475 623 1190 1950 2830 10300


Gage height, feet

Most recent instantaneous value: 3.29 04-25-2024   18:00 CDT
Graph of

Add up to 2 more sites and replot for "Gage height, feet"

?


Create presentation-quality / stand-alone graph.   Subscribe to WaterAlert      

See this graph on the Monitoring Location Pages


Gage height, feet, Upstream

Most recent instantaneous value: 3.31 04-25-2024   18:15 CDT
Graph of

Add up to 2 more sites and replot for "Gage height, feet, Upstream"

?


Create presentation-quality / stand-alone graph.   Subscribe to WaterAlert      

See this graph on the Monitoring Location Pages