USGS 07387040 Vermilion Bay near Cypremort Point, LA

PROVISIONAL DATA SUBJECT TO REVISION

Click to hidestation-specific text
Customized Alerts by Text or E-mail at WaterAlert Subscription
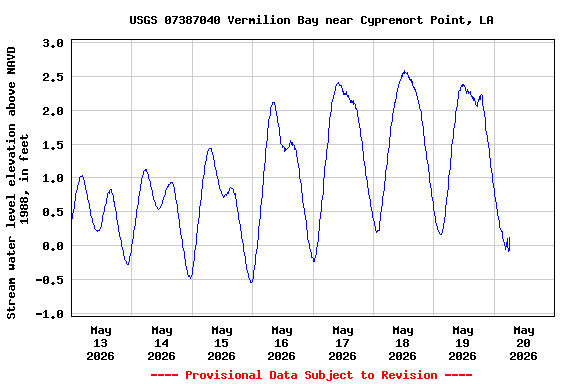
Available Parameters Available Period
  
2007-10-01  2024-04-30
2024-01-01  2024-04-30
2024-01-01  2024-04-30
2007-10-01  2024-04-30
2007-10-01  2024-04-30
2007-10-01  2024-04-30
2016-04-06  2024-04-30


 (7)
 

  -- or --


Summary of all available data for this site
Instantaneous-data availability statement


Temperature, water, degrees Celsius

Most recent instantaneous value: 24.3 04-30-2024   13:00 CDT
Graph of

Add up to 2 more sites and replot for "Temperature, water, degrees Celsius"

?


Create presentation-quality / stand-alone graph.   Subscribe to WaterAlert      

See this graph on the Monitoring Location Pages


Wind speed, miles per hour

Most recent instantaneous value: 6.3 04-30-2024   13:00 CDT
Graph of

Add up to 2 more sites and replot for "Wind speed, miles per hour"

?


Create presentation-quality / stand-alone graph.   Subscribe to WaterAlert      

See this graph on the Monitoring Location Pages


Wind direction, degrees clockwise from true north

Most recent instantaneous value: 317 04-30-2024   13:00 CDT
Graph of

Add up to 2 more sites and replot for "Wind direction, degrees clockwise from true north"

?


Create presentation-quality / stand-alone graph.   Subscribe to WaterAlert      

See this graph on the Monitoring Location Pages


Gage height, feet

Most recent instantaneous value: 3.27 04-30-2024   13:15 CDT
Graph of

Add up to 2 more sites and replot for "Gage height, feet"

?


Create presentation-quality / stand-alone graph.   Subscribe to WaterAlert      

See this graph on the Monitoring Location Pages


Specific conductance, water, unfiltered, microsiemens per centimeter at 25 degrees Celsius

Most recent instantaneous value: 2160 04-30-2024   13:00 CDT
Graph of

Add up to 2 more sites and replot for "Specific conductance, water, unfiltered, microsiemens per centimeter at 25 degrees Celsius"

?


Create presentation-quality / stand-alone graph.   Subscribe to WaterAlert      

See this graph on the Monitoring Location Pages


Salinity, water, unfiltered, parts per thousand

Most recent instantaneous value: 1.1 04-30-2024   13:00 CDT
Graph of

Add up to 2 more sites and replot for "Salinity, water, unfiltered, parts per thousand"

?


Create presentation-quality / stand-alone graph.   Subscribe to WaterAlert      

See this graph on the Monitoring Location Pages


Stream water level elevation above NAVD 1988, in feet

Most recent instantaneous value: 1.79 04-30-2024   13:15 CDT
Graph of

Add up to 2 more sites and replot for "Stream water level elevation above NAVD 1988, in feet"

?


Create presentation-quality / stand-alone graph.   Subscribe to WaterAlert      

See this graph on the Monitoring Location Pages