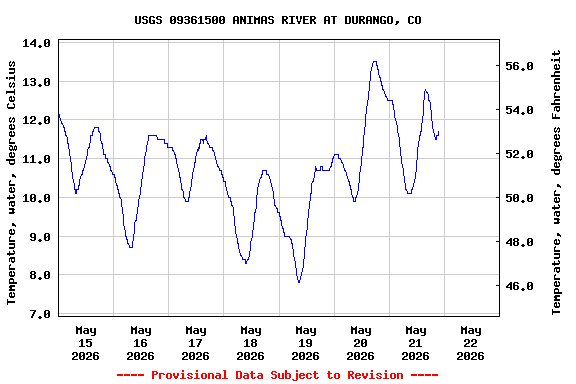
Most recent instantaneous value: 11.7 05-21-2026 21:30 MDT
See this graph on the Monitoring Location Pages
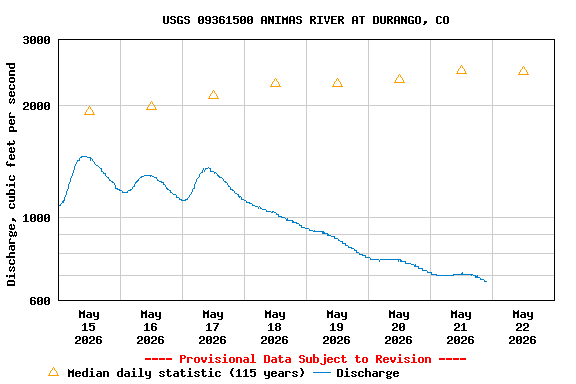
| Min (1977) | Most Recent Instantaneous Value May 22 | 25th percen- tile | Median | Mean | 75th percen- tile | Max (1920) |
|---|---|---|---|---|---|---|
| 290 | 674 | 1650 | 2460 | 2670 | 3240 | 9260 |
Specific conductance, water, unfiltered, microsiemens per centimeter at 25 degrees Celsius |
||
|
||
![]() U.S. Department of the Interior |
U.S. Geological Survey
U.S. Department of the Interior |
U.S. Geological Survey
Title: USGS Current Conditions for the Nation
URL:
Page Contact Information: Colorado Water Data Support Team
Page Last Modified: 2026-05-22 00:04:17 EDT
4.31 3.26 vaww01