USGS 13154500 SNAKE RIVER AT KING HILL ID

PROVISIONAL DATA SUBJECT TO REVISION

Click to hidestation-specific text
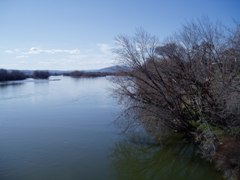
Snake River at King Hill, ID - USGS file photo USGS Idaho Water Science Center celebrating more than 100 Years of streamgage Records

> Rating Information

> Important note on temperature values

Station operated with funding provided by the U.S. Geological Survey Groundwater and Streamflow Information Program (GWSIP) and National Water Quality Assessment Program (NWQP), and in cooperation with the Idaho Department of Water Resources (IDWR)

and
This station managed by the Boise Field Office.

Available Parameters Available Period
  
2007-10-01  2024-11-23
1987-05-27  2024-11-23
2007-10-01  2024-11-23


 (7)
 

  -- or --


Summary of all available data for this site
Instantaneous-data availability statement


Temperature, water, degrees Celsius

Most recent instantaneous value: 10.8 11-23-2024   06:45 MST
Graph of  Temperature, water, degrees Celsius

Add up to 2 more sites and replot for "Temperature, water, degrees Celsius"

?


Create presentation-quality / stand-alone graph.   Subscribe to WaterAlert      

See this graph on the Monitoring Location Pages


Discharge, cubic feet per second

Most recent instantaneous value: 6600 11-23-2024   06:45 MST
Graph of  Discharge, cubic feet per second

Add up to 2 more sites and replot for "Discharge, cubic feet per second"

?


Create presentation-quality / stand-alone graph.   Subscribe to WaterAlert      

See this graph on the Monitoring Location Pages


Daily discharge, cubic feet per second -- statistics for Nov 23 based on 115 water years of record more
Min
(2022)
Most Recent
Instantaneous
Value Nov 23
25th
percen-
tile
Median Mean 75th
percen-
tile
Max
(1984)
6160 6600 7980 9380 10400 12200 22600


Gage height, feet

Most recent instantaneous value: 5.90 11-23-2024   06:45 MST
Graph of  Gage height, feet

Add up to 2 more sites and replot for "Gage height, feet"

?


Create presentation-quality / stand-alone graph.   Subscribe to WaterAlert      

See this graph on the Monitoring Location Pages