USGS 0164578734 SNAKEDEN BRANCH ABOVE LAKE AUDUBON AT RESTON, VA

PROVISIONAL DATA SUBJECT TO REVISION

Available Parameters Available Period
  
2021-03-11  2026-02-25
2021-03-11  2026-02-25
2021-03-11  2026-02-25
2021-03-11  2026-02-25
2021-03-11  2026-02-25
2021-03-11  2026-02-25
2021-03-11  2026-02-25
2022-11-14  2026-02-25
2023-02-25  2026-02-25


 (7)
 

  -- or --


Summary of all available data for this site
Instantaneous-data availability statement


Temperature, water, degrees Celsius

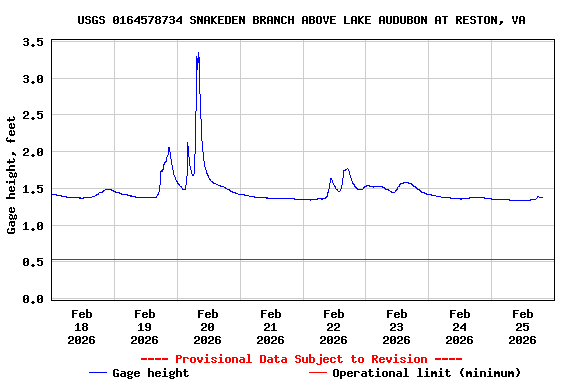
Most recent instantaneous value: 6.3 02-25-2026   18:20 EST
Graph of  Temperature, water, degrees Celsius

Add up to 2 more sites and replot for "Temperature, water, degrees Celsius"

?


Create presentation-quality / stand-alone graph.   Subscribe to WaterAlert      

See this graph on the Monitoring Location Pages


Discharge, cubic feet per second

Most recent instantaneous value: 1.23 02-25-2026   18:20 EST
Graph of  Discharge, cubic feet per second

Add up to 2 more sites and replot for "Discharge, cubic feet per second"

?


Create presentation-quality / stand-alone graph.   Subscribe to WaterAlert      

See this graph on the Monitoring Location Pages


Daily discharge, cubic feet per second -- statistics for Feb 25 based on 4 water years of record more
Min
(2023)
25th
percen-
tile
Median Most Recent
Instantaneous
Value Feb 25
Mean 75th
percen-
tile
Max
(2022)
0.54 0.56 0.69 1.23 2 4.9 6.25


Gage height, feet

Most recent instantaneous value: 1.38 02-25-2026   18:20 EST
Graph of  Gage height, feet

Add up to 2 more sites and replot for "Gage height, feet"

?


Create presentation-quality / stand-alone graph.   Subscribe to WaterAlert      

See this graph on the Monitoring Location Pages


Specific conductance, water, unfiltered, microsiemens per centimeter at 25 degrees Celsius

Most recent instantaneous value: 929 02-25-2026   18:20 EST
Graph of  Specific conductance, water, unfiltered, microsiemens per centimeter at 25 degrees Celsius

Add up to 2 more sites and replot for "Specific conductance, water, unfiltered, microsiemens per centimeter at 25 degrees Celsius"

?


Create presentation-quality / stand-alone graph.   Subscribe to WaterAlert      

See this graph on the Monitoring Location Pages


Dissolved oxygen, water, unfiltered, milligrams per liter

Most recent instantaneous value: 11.7 02-25-2026   18:20 EST
Graph of  Dissolved oxygen, water, unfiltered, milligrams per liter

Add up to 2 more sites and replot for "Dissolved oxygen, water, unfiltered, milligrams per liter"

?


Create presentation-quality / stand-alone graph.   Subscribe to WaterAlert      

See this graph on the Monitoring Location Pages


pH, water, unfiltered, field, standard units

Most recent instantaneous value: 7.2 02-25-2026   18:20 EST
Graph of  pH, water, unfiltered, field, standard units

Add up to 2 more sites and replot for "pH, water, unfiltered, field, standard units"

?


Create presentation-quality / stand-alone graph.   Subscribe to WaterAlert      

See this graph on the Monitoring Location Pages


Turbidity, water, unfiltered, monochrome near infra-red LED light, 780-900 nm, detection angle 90 +-2.5 degrees, formazin nephelometric units (FNU)

Most recent instantaneous value: 1.1 02-25-2026   18:20 EST
Graph of  Turbidity, water, unfiltered, monochrome near infra-red LED light, 780-900 nm, detection angle 90 +-2.5 degrees, formazin nephelometric units (FNU)

Add up to 2 more sites and replot for "Turbidity, water, unfiltered, monochrome near infra-red LED light, 780-900 nm, detection angle 90 +-2.5 degrees, formazin nephelometric units (FNU)"

?


Create presentation-quality / stand-alone graph.   Subscribe to WaterAlert      

See this graph on the Monitoring Location Pages


Nitrate plus nitrite, water, in situ, milligrams per liter as nitrogen

Most recent instantaneous value: 1.06 02-25-2026   18:20 EST
Graph of  Nitrate plus nitrite, water, in situ, milligrams per liter as nitrogen

Add up to 2 more sites and replot for "Nitrate plus nitrite, water, in situ, milligrams per liter as nitrogen"

?


Create presentation-quality / stand-alone graph.   Subscribe to WaterAlert      

See this graph on the Monitoring Location Pages


Count of samples collected by autosampler, number

Most recent instantaneous value: 0 02-25-2026   18:20 EST
Graph of  Count of samples collected by autosampler, number

Add up to 2 more sites and replot for "Count of samples collected by autosampler, number"

?


Create presentation-quality / stand-alone graph.   Subscribe to WaterAlert      

See this graph on the Monitoring Location Pages