USGS 12148500 TOLT RIVER NEAR CARNATION, WA

PROVISIONAL DATA SUBJECT TO REVISION

Click to hidestation-specific text
Arrow

Additional Data and Information.-- Latest shifted rating.

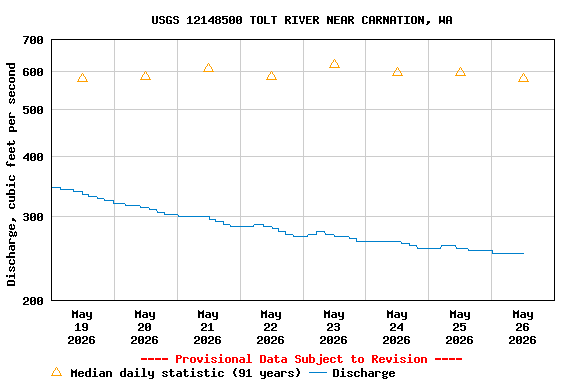
Flood Stage.--The National Weather Service Flood Flow for this station is 5,000 cfs. King County has Flood Phase Information for this gage.

Funding for this site is provided by the cooperators / programs below:


Boating safety tips

This station managed by the Northwest Washington Field Office (Ferndale).

Available Parameters Available Period
  
2016-10-01  2026-02-25
2023-09-20  2026-02-25
1987-10-01  2026-02-25
2007-10-01  2026-02-25
2024-08-13  2026-02-25


 (7)
 

  -- or --


Summary of all available data for this site
Instantaneous-data availability statement


Temperature, water, degrees Celsius

Most recent instantaneous value: 5.4 02-25-2026   01:15 PST
Graph of  Temperature, water, degrees Celsius

Add up to 2 more sites and replot for "Temperature, water, degrees Celsius"

?


Create presentation-quality / stand-alone graph.   Subscribe to WaterAlert      

See this graph on the Monitoring Location Pages


Temperature, air, degrees Celsius

Most recent instantaneous value: 1.1 02-25-2026   01:15 PST
Graph of  Temperature, air, degrees Celsius

Add up to 2 more sites and replot for "Temperature, air, degrees Celsius"

?


Create presentation-quality / stand-alone graph.   Subscribe to WaterAlert      

See this graph on the Monitoring Location Pages


Discharge, cubic feet per second

Most recent instantaneous value: 323 02-25-2026   01:15 PST
Graph of  Discharge, cubic feet per second

Add up to 2 more sites and replot for "Discharge, cubic feet per second"

?


Create presentation-quality / stand-alone graph.   Subscribe to WaterAlert      

See this graph on the Monitoring Location Pages


Daily discharge, cubic feet per second -- statistics for Feb 25 based on 91 water years of record more
Min
(1941)
Most Recent
Instantaneous
Value Feb 25
25th
percen-
tile
Median Mean 75th
percen-
tile
Max
(1950)
214 323 387 521 664 810 2510


Gage height, feet

Most recent instantaneous value: 5.15 02-25-2026   01:15 PST
Graph of  Gage height, feet

Add up to 2 more sites and replot for "Gage height, feet"

?


Create presentation-quality / stand-alone graph.   Subscribe to WaterAlert      

See this graph on the Monitoring Location Pages


Turbidity, water, unfiltered, monochrome near infra-red LED light, 780-900 nm, detection angle 90 +-2.5 degrees, formazin nephelometric units (FNU)

Most recent instantaneous value: 1.3 02-25-2026   01:15 PST
Graph of  Turbidity, water, unfiltered, monochrome near infra-red LED light, 780-900 nm, detection angle 90 +-2.5 degrees, formazin nephelometric units (FNU)

Add up to 2 more sites and replot for "Turbidity, water, unfiltered, monochrome near infra-red LED light, 780-900 nm, detection angle 90 +-2.5 degrees, formazin nephelometric units (FNU)"

?


Create presentation-quality / stand-alone graph.   Subscribe to WaterAlert      

See this graph on the Monitoring Location Pages