Location.--Latitude 46°35'44", Longitude
122°27'30", in NE 1/4 SW 1/4 Section 20, Township 13 North,
Range 3 East, in Lewis County, Hydrologic Unit 17080005, on
right bank 0.9 mile upstream from Bear Creek, 3.5 miles southeast of
Cinebar, and at river mile
7.1. Drainage
area is 141 mi2. Elevation
of gage is 600 feet above NGVD of 1929.
Maps.--Locate
this station on a
map of the basin (PDF).
Additional Data and Information.-- Latest shifted
rating.
Flood Stage.--The National Weather Service has not
established a Flood
Stage for this station.
Funding for this site is provided by the
cooperators / programs below:
Station Notes
The
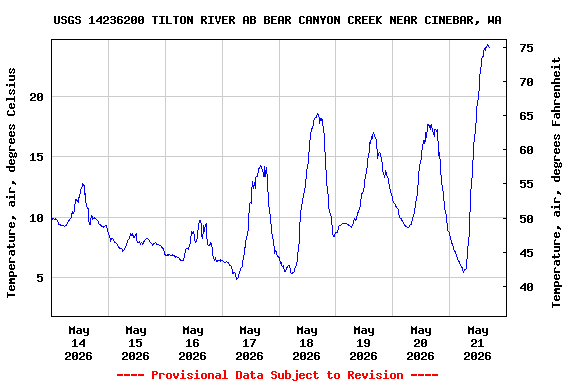
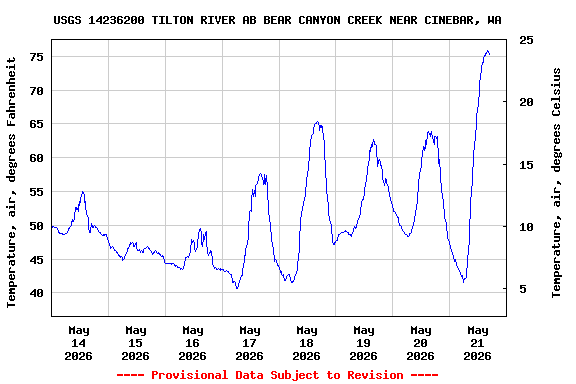
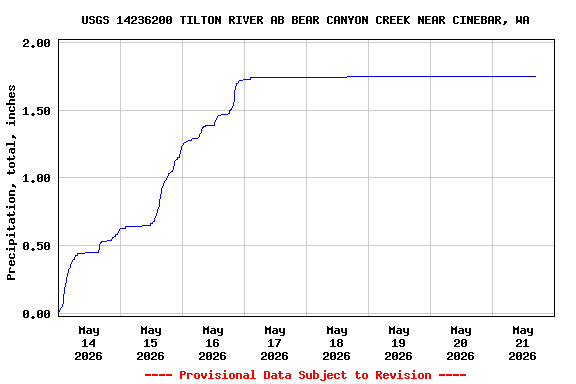
15-minute precipitation and air temperature data for this station
are temporary and will only be displayed for 120 days.
Time series of 15-minute or cumulative daily values will NOT be
available for retrieval following the 120-day display period.
Although the instrumentation is calibrated at least once/year, the
temporary classification means that documented routine inspections
and other quality assurance measures are not performed that would
make the data acceptable for archival, retrieval, or future use in
general scientific or interpretive studies.
Boating safety tips