
#5NewThings
An update of next-gen monitoring location page features
The Water Resources Mission Area is spotlighting five newly available features on our next-gen monitoring location pages this week! To compliment this blog post, we will show off our work on Instagram and Twitter, using the hashtag #5NewThings. These improvements showcase our adoption of modern web technologies as we update our data delivery paradigm.
#1 Flood benchmarks
The next-gen monitoring location pages now show flood benchmarks on the hydrographs. These benchmarks allow users to understand how the current gage height relates to the risk of potential flooding. The flood categories used by the National Weather Service (NWS) are defined here .
Action Stage - the stage which, when reached by a rising stream, represents the level where the NWS or a partner/user needs to take some type of mitigation action in preparation for possible significant hydrologic activity.
Flood Stage - an established gage height for a given location above which a rise in water surface level begins to create a hazard to lives, property, or commerce. The issuance of flood advisories or warnings is linked to flood stage.
Moderate Flooding - is defined to have some inundation of structures and roads near the stream. Some evacuations of people and/or transfer of property to higher elevations may be necessary. A flood warning should be issued if moderate flooding is expected during the event. In remote areas with few specific impacts, floods with 15-40 year recurrence interval would be assumed to be causing moderate flooding on streams in the area.
Major Flooding - is defined to have extensive inundation of structures and roads. Significant evacuations of people and/or transfer of property to higher elevations are necessary. A flood warning should be issued if major flooding is expected during the event. In remote areas with few specific impacts, floods with 50-100 year recurrence interval would be assumed to be causing major flooding on streams in the area.
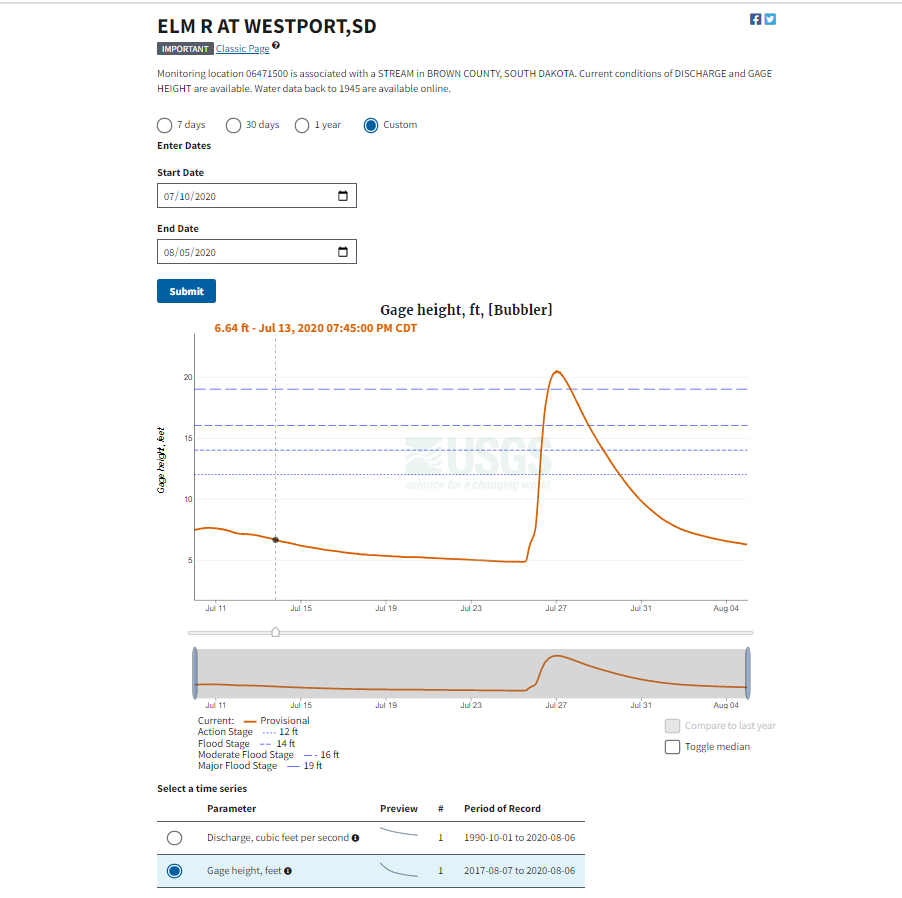
A hydrograph during a flooding event displaying the flood stage benchmarks at Elm River at Westport, South Dakota. https://waterdata.usgs.gov/monitoring-location/06471500/?agency_cd=USGS#parameterCode=00065&startDT=2020-07-10&endDT=2020-08-05 .
#2 State of hydrograph for bookmarking and linking
The next-gen monitoring location pages serve a huge range of users from kayakers to emergency managers. Users are now able to bookmark and share a hydrograph in the way that they requested it. Users can share custom hydrographs generated with specific time-series statistics, parameter codes, dates, and compare settings. For example, a user may be interested in the changes in gage height at the USGS gage Colorado River at Lee's Ferry, AZ over the course of the November 2012 Glen Canyon Dam High Flow Experimental Release . After choosing a custom time range and the gage height parameter, the URL in the browser can be used to share or return to the same settings .
#3 NLDI (The Hydro Network-Linked Data Index)
By utilizing the Hydro Network-Linked Data Index (NLDI ), monitoring locations can be put into the context of a catchment or basin. Each active stream site has an upstream basin in NLDI, as you can see here:
![Screenshot of the upstream basin, shown as a grey overlay, for monitoring location05370000, [Yahara River at East Main Street at Madison, WI]](https://waterdata.usgs.gov/blog/static/5-new-things-pt1/image2.png)
Screenshot of the upstream basin for monitoring location05370000, Yahara River at East Main Street at Madison, WI .
#4 Brush & Zoom
The brush and zoom capability allows the user to easily select any part of the hydrograph for closer examination. On the lower hydrograph, the user simply clicks on the brush handles and drags them to the desired timeframe. The upper hydrograph reflects the new time selection. The handles are big enough for use on mobile devices.
An animation of the brush and zoom capability
#5 Table of hydrograph data
A frequent request that comes into our user feedback email box concerns the availability of the underlying hydrograph data. Now users can explore the data behind the graph by using the ‘Table of hydrograph data’ feature on the next-gen monitoring location pages. One click expands the table for a detailed view of the data behind the hydrograph.
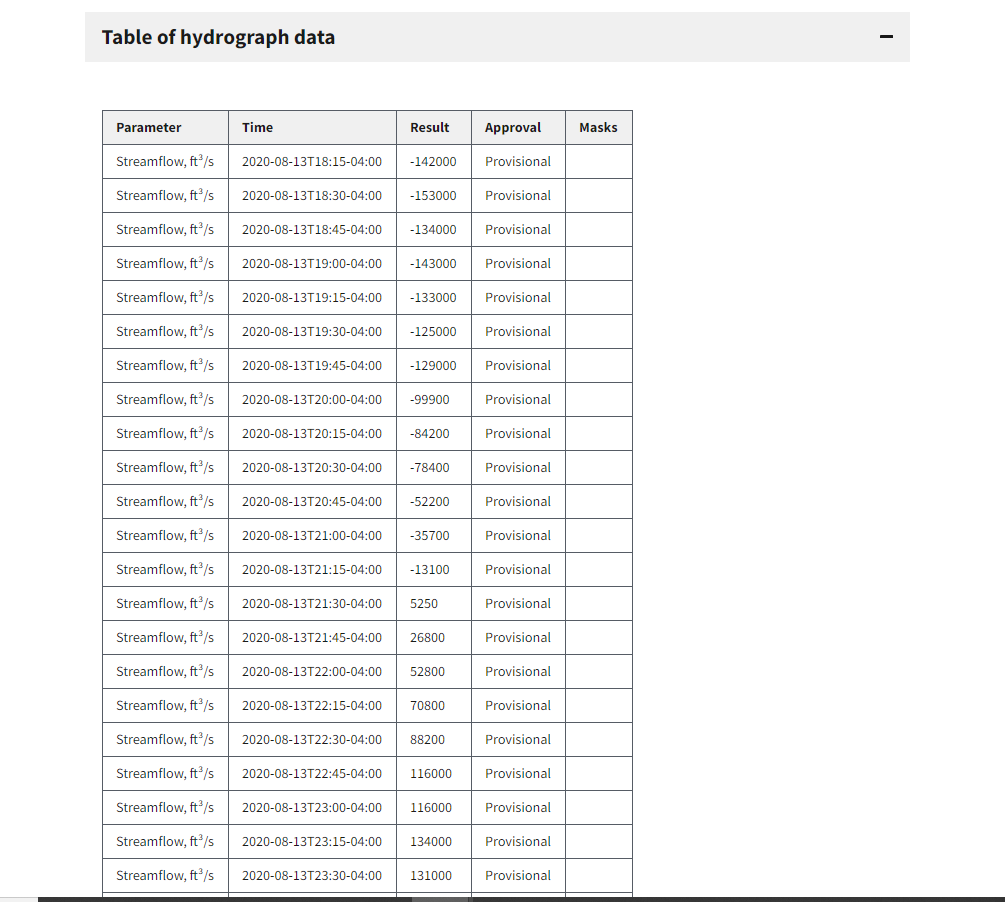
Table of discharge (streamflow) data at Monitoring location 02246500, the St. Johns River in Jacksonville, FL https://waterdata.usgs.gov/monitoring-location/02246500/?agency_cd=USGS#parameterCode=00060 .
Categories:
Keywords:
Related Posts
Water Quality Data Delivery Listening Sessions
July 28, 2020
Water Quality Data Delivery Listening Sessions Starting on August 3, 2020, the WDFN Team will be conducting a month of activities aimed at gathering input from both internal and external users to help guide development activities related to water-quality data delivery.
Decommissioning of the National Water Census - Data Portal
July 22, 2020
What are you decommissioning? As the USGS Water Mission Area (WMA) undertakes modernizing data delivery as part of implementation of the U.S. Geological Survey Water Science Strategy (Circular 1382-G ), resources will be directed away from legacy applications to new development and delivery mechanisms.
Release Notes for July 21st, 2020
July 21, 2020
What have we been up to? Pubs Warehouse moved to the Cloud Behind the scenes work New features and tools Pubs Warehouse on the Cloud The Water Data for the Nation team is the primary development team for another high profile application, the USGS Publications Warehouse .
Doing user research to design the next-gen WDFN
July 17, 2020
The USGS Water Resources Mission Area (WMA) is striving to make our water data easier to access for our users. This involves stepping back and reviewing how users currently use waterdata.
Release Notes for late March 2020
April 10, 2020
What have we been up to? Image server work Period parameter Axis scaling Networks page New features and tools Image export from monitoring location pages One of the most requested features we receive from users is the ability to export images from the monitoring location pages.