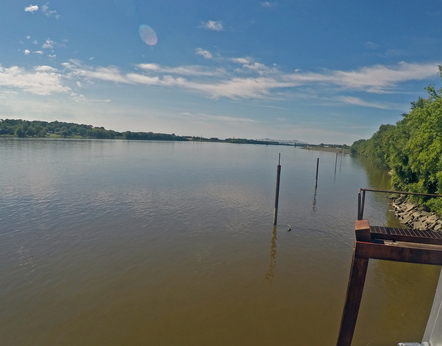
LOCATION.--Lat 41°46'50", long 90°15'07"
referenced to North American Datum of 1927, in SW 1/4 SE 1/4 NW 1/4
sec.34, T.81 N., R.6 E., Clinton County, IA, Hydrologic Unit
07080101, on right bank near end of 8th Avenue in Camanche, 5.0 mi
upstream from Wapsipinicon River, 6.4 mi downstream from Clinton,
10.6 mi downstream from Lock and Dam 13, and 511.8 mi upstream from
Ohio River. (map)
DRAINAGE AREA.--85,600 mi2.
SURFACE-WATER RECORDS
PERIOD OF RECORD.--Discharge records from June to August 1873
(fragmentary), October 1873 to current year. October 1932 to
September 1939, published as "at Le Claire". June 1873 to
December 1932, published in the Iowa State Planning Board report
"Stream-flow records of Iowa, 1873-1932".
REVISED RECORDS.--WDR IA-75-1: 1974.
GAGE.--Water-stage recorder. Datum of gage is 562.68 ft above
National Geodetic Vertical Datum of 1929. June 1873 to May 31, 1934,
non-recording gage, and June 1, 1934, to September 30, 1939,
water-stage recorder, both at site 14.8 mi downstream at Le Claire at
datum 0.07 ft lower; October 1, 1939, to September 30, 1955,
water-stage recorder at site 10.6 mi upstream at Lock and Dam 13 at
datum 5.48 ft higher; October 1, 1955, to June 5, 1969, water-stage
recorder at same site and datum; June 6, 1969, to September 16, 1988,
water-stage recorder at site 400 ft upstream at same datum; since
October 1, 1958, auxiliary water-stage recorder at site 10.6 mi
upstream at Lock and Dam 13 at datum 5.48 ft higher.
REMARKS.--Minor flow regulation caused by navigation dams.
WATER-QUALITY RECORDS
PERIOD OF RECORD.--Water years 1975-1987, 1995-current year.
PERIOD OF DAILY RECORD.--
SPECIFIC CONDUCTANCE: Daily instantaneous values, July 1975 to
September 1976, October 1978 to September 1979, October 1979 to
September 1981. Daily instantaneous values collected in conjunction
with suspended-sediment samples, October 1994 to September 1997,
records fragmentary.
WATER TEMPERATURE: Daily instantaneous values, July 1975 to September
1976, October 1980 to September 1981. Daily instantaneous values
collected in conjunction with suspended-sediment samples, January
1995 to September 1997, records fragmentary. Daily
minimum/mean/maximum, October 1977 to September 1978. Daily
minimum/maximum, October 1978 to September 1980, October 1981 to
September 1986, records fragmentary. Daily mean, July 2012 to current
year.
SUSPENDED-SEDIMENT CONCENTRATION AND DISCHARGE: October 1994 to
September 1997.
 Site Information