Warning: Javascript must be enabled to use all the features on this page!


Page Loading - Please Wait...

Click to hideNews Bulletins
Click to hide state-specific text

Boating safety tips are available from the U.S. Coast Guard.

NOTE: Station Numbers for Iowa precipitation gages have changed (see list).


USGS 06808500 West Nishnabotna River at Randolph, IA

PROVISIONAL DATA SUBJECT TO REVISION

Click to hidestation-specific text

> Site Information

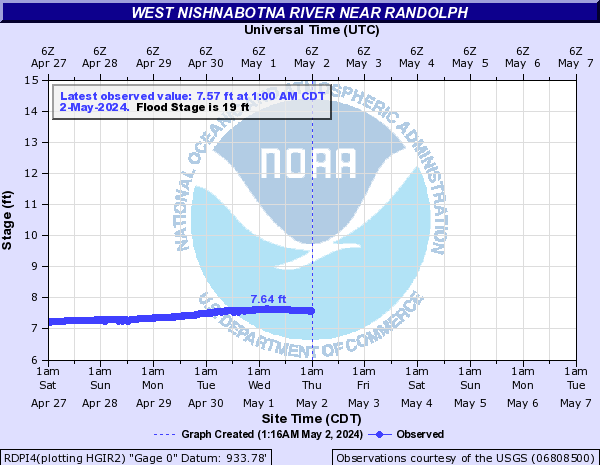
> National Weather Service River Forecast

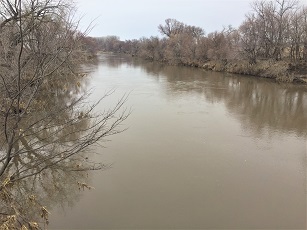
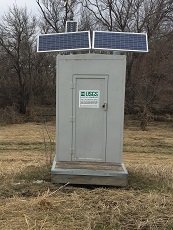
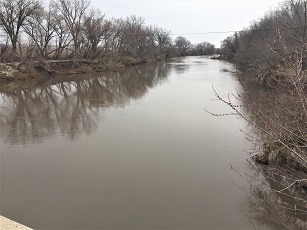
> Images

Funding For This Site Provided By:

NOTE: Real-time data for water quality parameters nitrate and turbidity unavailable during the winter season.

Link to Upstream Gage

Iowa WSC Gage Network

Link to Downstream Gage


This station managed by the Council Bluffs Field Office.

Available Parameters Period of Record
  
2016-03-02  2024-12-29
1948-06-01  2024-12-29
2016-03-02  2024-11-21
2016-03-02  2024-11-21
2016-03-02  2024-11-21
2016-01-01  2024-12-29
2016-03-02  2024-11-21


 (365)
 

  -- or --


Summary of all available data for this site
Instantaneous-data availability statement


Temperature, water, degrees Celsius


Graph of DAILY Temperature, water, degrees Celsius

Add up to 2 more sites and replot for "Temperature, water, degrees Celsius"

?


Create presentation-quality graph.  


Discharge, cubic feet per second


Graph of DAILY Discharge, cubic feet per second

Add up to 2 more sites and replot for "Discharge, cubic feet per second"

?


Create presentation-quality graph.  


Phosphorus, water, unfiltered, milligrams per liter as phosphorus


Graph of DAILY Phosphorus, water, unfiltered, milligrams per liter as phosphorus

Add up to 2 more sites and replot for "Phosphorus, water, unfiltered, milligrams per liter as phosphorus"

?


Create presentation-quality graph.  


Turbidity, water, unfiltered, monochrome near infra-red LED light, 780-900 nm, detector angles at 90 +-2.5 degrees and 0-45 degrees, ratiometric correction, FBRU


Graph of DAILY Turbidity, water, unfiltered, monochrome near infra-red LED light, 780-900 nm, detector angles at 90 +-2.5 degrees and 0-45 degrees, ratiometric correction, FBRU

Add up to 2 more sites and replot for "Turbidity, water, unfiltered, monochrome near infra-red LED light, 780-900 nm, detector angles at 90 +-2.5 degrees and 0-45 degrees, ratiometric correction, FBRU"

?


Create presentation-quality graph.  


Nitrate plus nitrite, water, total, short tons per day as nitrogen


Graph of DAILY Nitrate plus nitrite, water, total, short tons per day as nitrogen

Add up to 2 more sites and replot for "Nitrate plus nitrite, water, total, short tons per day as nitrogen"

?


Create presentation-quality graph.  


Phosphorus, water, unfiltered, short tons of phosphorus per day


Graph of DAILY Phosphorus, water, unfiltered, short tons of phosphorus per day

Add up to 2 more sites and replot for "Phosphorus, water, unfiltered, short tons of phosphorus per day"

?


Create presentation-quality graph.  


Nitrate plus nitrite, water, in situ, milligrams per liter as nitrogen


Graph of DAILY Nitrate plus nitrite, water, in situ, milligrams per liter as nitrogen

Add up to 2 more sites and replot for "Nitrate plus nitrite, water, in situ, milligrams per liter as nitrogen"

?


Create presentation-quality graph.