PROVISIONAL DATA SUBJECT TO REVISION
Click to hidestation-specific text
Funding for this site is provided by:
 Site Information
LOCATION.--Lat 43°05'37.3", long
75°09'28.5" referenced to North American Datum of
1983, Herkimer County, NY, Hydrologic Unit 02020004, on left
bank 750 ft upstream from bridge on County Highway 37 (Dyke
Road), 0.5 mi southwest of West Schuyler, and 2.0 mi east of
Utica.
DRAINAGE AREA.--553 mi².
PERIOD OF RECORD.--Miscellaneous measurements--1988-92, 2004-14, September 2014 to current year.
GAGE.--Water-stage recorder and crest-stage gage. Datum of gage is 386.02 ft above NAVD of 1988. Prior to September 2014, nonrecording gage at site 175 ft downstream at datum 8.00 ft lower.
REMARKS.--During canal navigation season, water is received from Black River basin through Black River Canal flowing south. Water is diverted into (or may occasionally be received from) Oswego River basin through summit level of Erie (Barge) Canal between New London and Utica. Diurnal fluctuation caused by locks and dams on Erie (Barge) Canal. Regulation by Delta Reservoir (station 01335900).
Water Years 2015-23: Records good except those for estimated daily discharges, which are poor.
EXTREMES FOR PERIOD OF RECORD.--Maximum discharge, 12,800 ft³/s, Nov. 2, 2019, gage height, 19.22 ft; minimum discharge, 37 ft³/s, Sept. 26, 2014, gage height, 3.16 ft.
EXTREMES OUTSIDE PERIOD OF RECORD.--Flood of Sept. 9, 2011, reached a stage of 21.47 ft, flood of Mar. 5, 1979, reached a stage of 21.47 ft, flood of Mar. 14, 1977, reached a stage of 22.37 ft, and flood of Jan. 4, 1907, reached a stage of 24.58 ft, all at site 4.2 mi upstream, from information provided by National Weather Service.
Summary of all available data for this site
Instantaneous-data availability statement
 WaterAlert – get an
email or text (SMS) alert based on your chosen threshold.
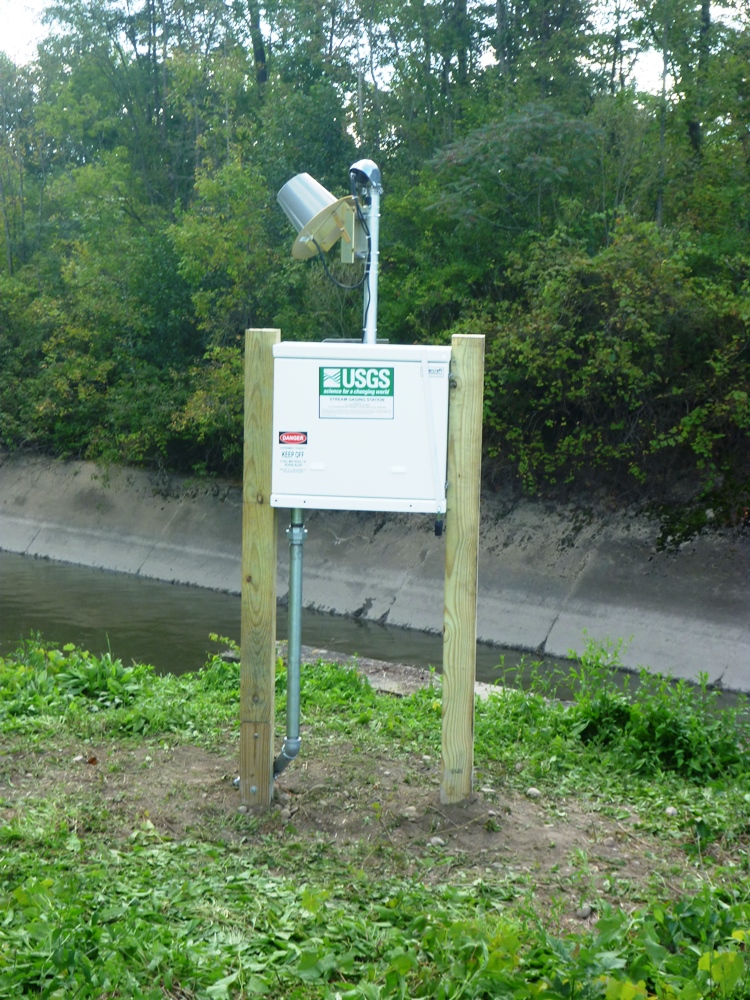
 Station image