LOCATION.--Lat 42°13'49", long
74°23'35" referenced to North American Datum of 1983,
Greene County, NY, Hydrologic Unit 02020005, on right bank
about 400 ft upstream from Beech Ridge Brook, 0.3 mi upstream
from State Highway 42 bridge, and 1.4 mi north of West
Kill.
DRAINAGE AREA.--27 mi².
PERIOD OF RECORD.--Occasional miscellaneous discharge
measurements, water years 1953, 1956, 1987, 1996, annual
maximum gage heights only--1965-69. October 1997 to current
year.
REVISIONS HISTORY.--Discharge for the period July 1,
2018, to Dec. 1, 2020, was revised on Feb. 25, 2022, based on
changes to the stage-discharge rating.
GAGE.--Water-stage recorder and crest-stage gage. Datum
of gage is 1,370.67 ft above NGVD of 1929 and 1,370.06 ft above
NAVD of 1988 (VERTCON). Prior to Aug. 28, 2011, at datum 5.00
ft higher.
REMARKS.--Water Years 2014-23: Records fair except those
for estimated daily discharges, which are poor.
EXTREMES FOR PERIOD OF RECORD.--Maximum discharge,
19,100 ft³/s, Aug. 28, 2011, gage height, 19.03 ft, from rating
curve extended above 2,000 ft³/s on basis of slope-area
measurement of peak flow; minimum discharge, 1.3 ft³/s, Aug.
19, 21, 22, 23, 24, 2002, gage height, 5.81 ft, present datum;
minimum gage height, 2.30 ft, Aug. 26, 27, 2012.
EXTREMES OUTSIDE PERIOD OF RECORD.--Maximum discharge,
6,500 ft³/s, Jan. 19, 1996, gage height, 16.06 ft, present
datum, from floodmarks, on basis of contracted-opening
measurement of peak flow.

 Site Information
 WaterAlert – get an
email or text (SMS) alert based on your chosen threshold.
WaterAlert – get an
email or text (SMS) alert based on your chosen threshold.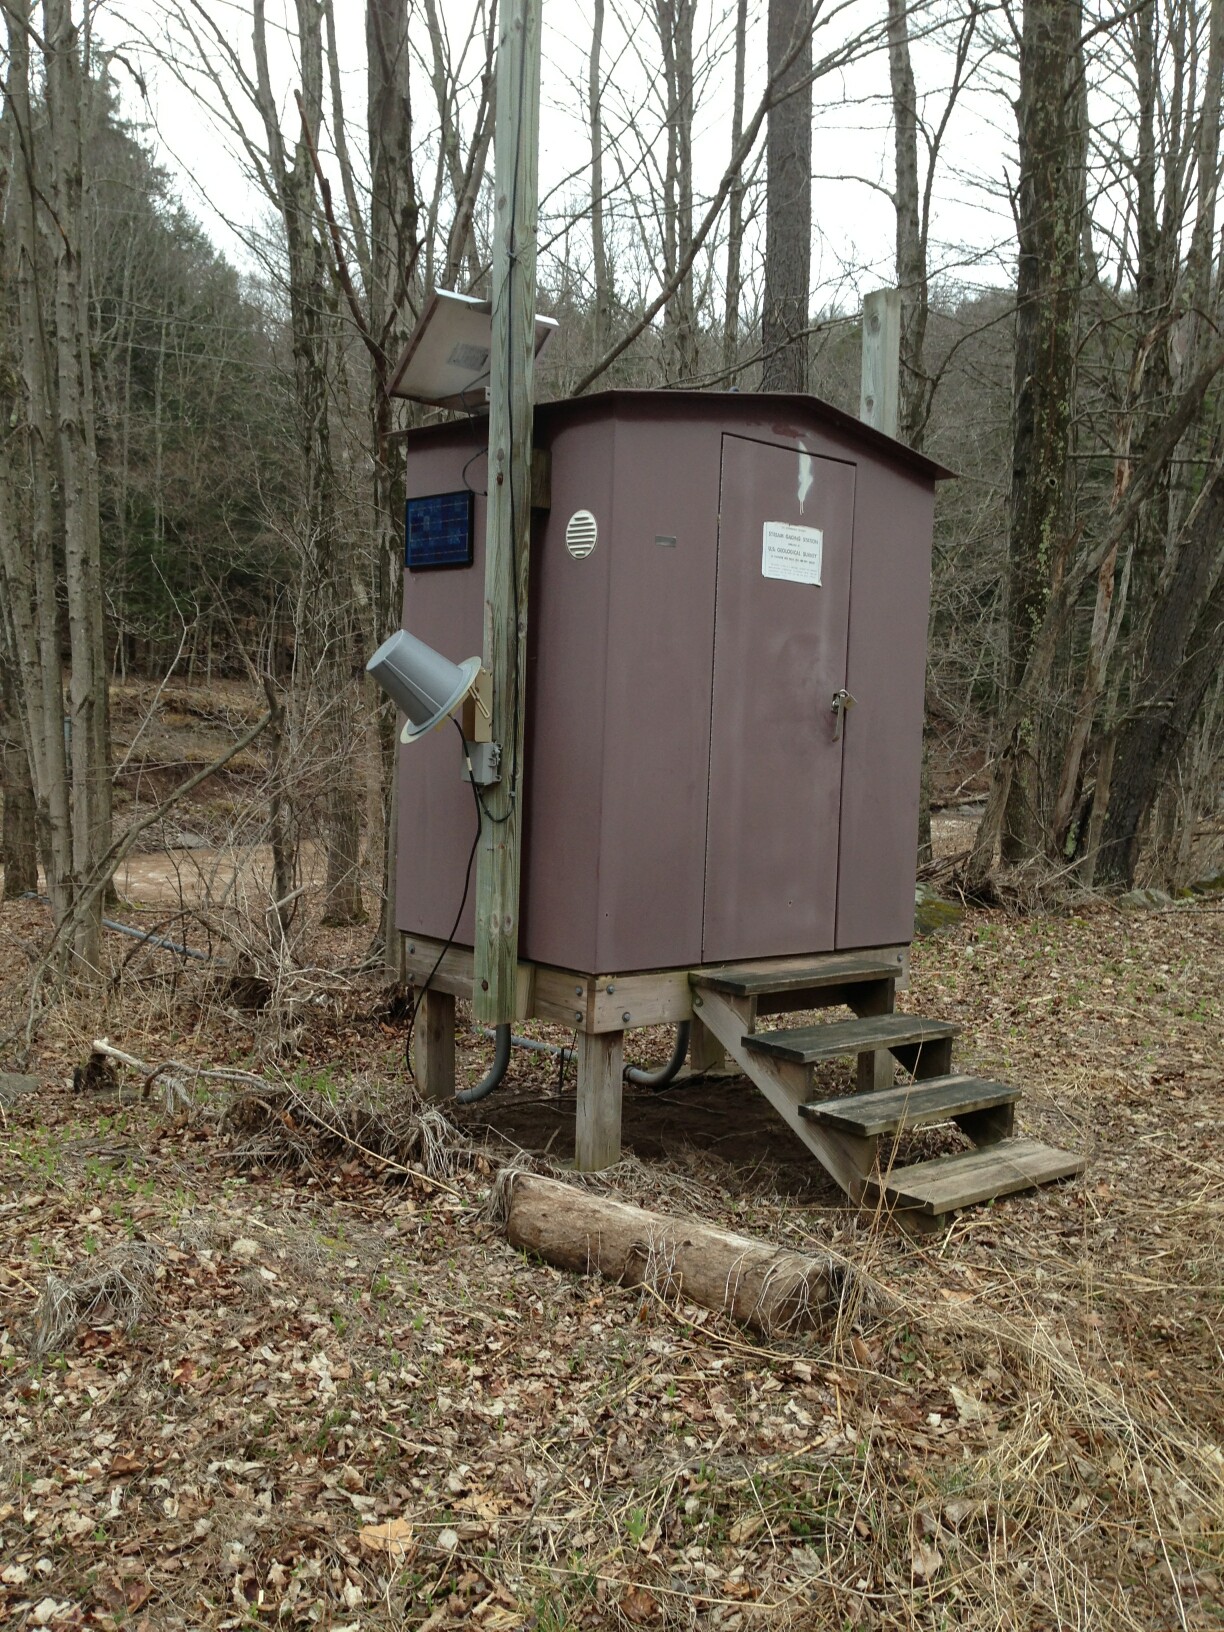 Station image