Funding for this site is provided by:
 STATION.
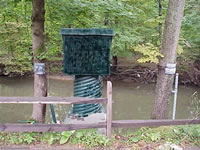
--01465798 POQUESSING CREEK AT GRANT AVENUE,
PHILADELPHIA, PA
LOCATION.--Lat 40`03'25", long
74`59'08", Philadelphia County, Hydrologic Unit 02040202, on
right bank 600 ft upstream from Interstate Highway 95, 3,000 ft
upstream from mouth, and in northeast Philadelphia.
DRAINAGE AREA.--21.4 square miles.
PERIOD OF RECORD.--July 1965 to current year. Records
for 1971-74 published in WDR PA-81-1.
REVISED RECORD.--WDR PA-86-1: 1985
GAGE.--Water-stage recorder, water-quality monitor,
crest-stage gage, and concrete low-water control. Datum of gage is 1.9
ft above North American Vertical Datum of 1988 (GNSS survey). Prior to
April 2, 2024, the datum of gage was erroneously reported as 2.68 ft
above National Geodetic Vertical Datum of 1929. Satellite telemetry at
station.
COOPERATION.--Station established and maintained by
the U.S. Geological Survey. Funding for the operation of this station
is provided by the City of Philadelphia, Water Department and the U. S.
Geological Survey.
REMARKS.--Flow occasionally affected by tide.
Calibration of water-quality
instrumentation is conducted exclusively by Philadelphia Water
Department personnel with USGS oversight. Erroneous or missing data,
resulting from instrument malfunction, are not the responsibility of
USGS.
GAGE HEIGHTS OF IMPORTANCE.-
Supplied by USGS: Maximum recordable gage height
(stage sensor operational limit) - 13.5 ft; Data transmitter
operational limit - 14.0 ft;
Supplied by NWS: No flood stage has been determined
for this station.

