LOCATION.--Lat 42°14'57", long
74°18'10" referenced to North American Datum of 1983,
Greene County, NY, Hydrologic Unit 02020005, on right bank 6 ft
downstream from bridge on Mill Hollow Road, and 1.3 mi
northeast of Jewett Center.
DRAINAGE AREA.--35.6 mi².
PERIOD OF RECORD.--Occasional low-flow and/or
miscellaneous discharge measurements, water years 1951,
1955-61, 1964, 1987, annual maximum only--1965-68, 1972-74,
1987, 1996. December 1996 to current year.
REVISIONS HISTORY.--WDR NY-99-1: 1996-97(M), 1998.
GAGE.--Water-stage recorder and crest-stage gage. Datum
of gage is 1,452.26 ft above NGVD of 1929 and 1,451.65 ft above
NAVD of 1988. Prior to December 1996, crest-stage gage at same
site at datum 4.50 ft higher.
REMARKS.--Water Years 2014-24: Records fair except those
for estimated daily discharges, which are poor.
EXTREMES FOR PERIOD OF RECORD.--Maximum discharge,
28,400 ft³/s, Aug. 28, 2011, gage height, 25.65 ft, from
floodmark, from rating curve extended above 3,700 ft³/s on
basis of contracted-opening measurements at gage heights 14.90
ft and 15.68 ft, present datum, and slope-area measurement at
gage height 25.65 ft; minimum discharge (since December 1996),
0.84 ft³/s, Aug. 13, 1997; minimum gage height, 2.12 ft, Oct.
11, 12, 13, Nov. 9, 17, 20, 2024.
 Site Information
 WaterAlert – get an
email or text (SMS) alert based on your chosen threshold.
WaterAlert – get an
email or text (SMS) alert based on your chosen threshold.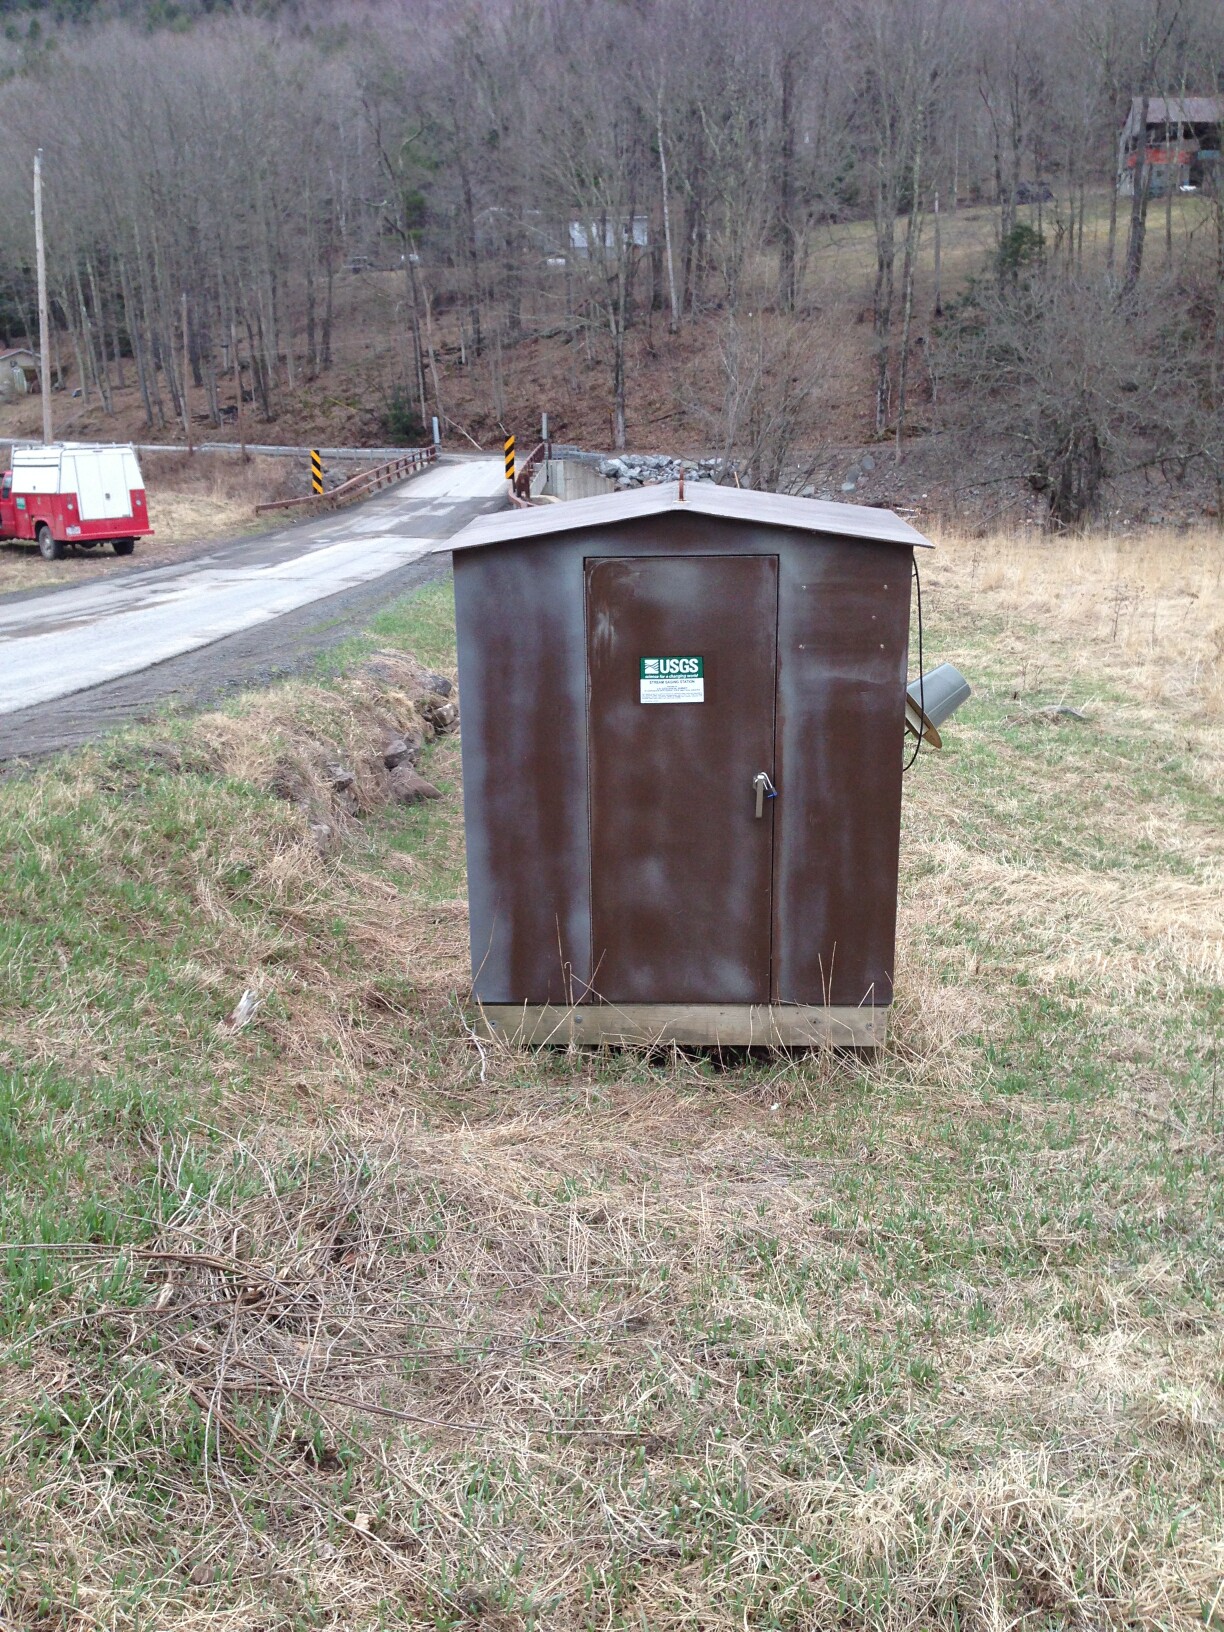 Station image