LOCATION.--Lat 42°52'41.8", long
74°02'26.7" referenced to North American Datum of
1983, Schenectady County, NY, Hydrologic Unit 02020004, on left
bank, 330 ft downstream of Lock 9 on the Erie (Barge) Canal,
8.0 mi west of Schenectady.
DRAINAGE AREA.--3,250 mi².
PERIOD OF RECORD.--December 2019 to current year (gage
heights only).
GAGE.--Water-stage recorder. Datum of gage is 199.46 ft
above NAVD of 1988.
REMARKS.--Considerable regulation of stage by Lock 9 on
the Erie (Barge) Canal about 330 ft upstream and Lock 8 about
7.0 mi downstream.
EXTREMES FOR PERIOD OF RECORD.--Maximum gage height,
37.15 ft, Apr. 8, 2022; minimum gage height recorded, 14.10 ft,
May 9, 10, 11, 2023, but may have been lower when water levels
were below the sensor.
PERIOD OF DAILY RECORD1.--WATER TEMPERATURE:
December 2021 to current year.
INSTRUMENTATION1.--Water-temperature recorder
provides 5-minute-interval readings.
EXTREMES FOR PERIOD OF DAILY RECORD1.--WATER
TEMPERATURE: Maximum, 29.2°C, July 15, 2024; minimum, 0.0°C, on
many days during winter period.
1 Water-Quality Records
 Site Information
 WaterAlert – get an
email or text (SMS) alert based on your chosen threshold.
WaterAlert – get an
email or text (SMS) alert based on your chosen threshold.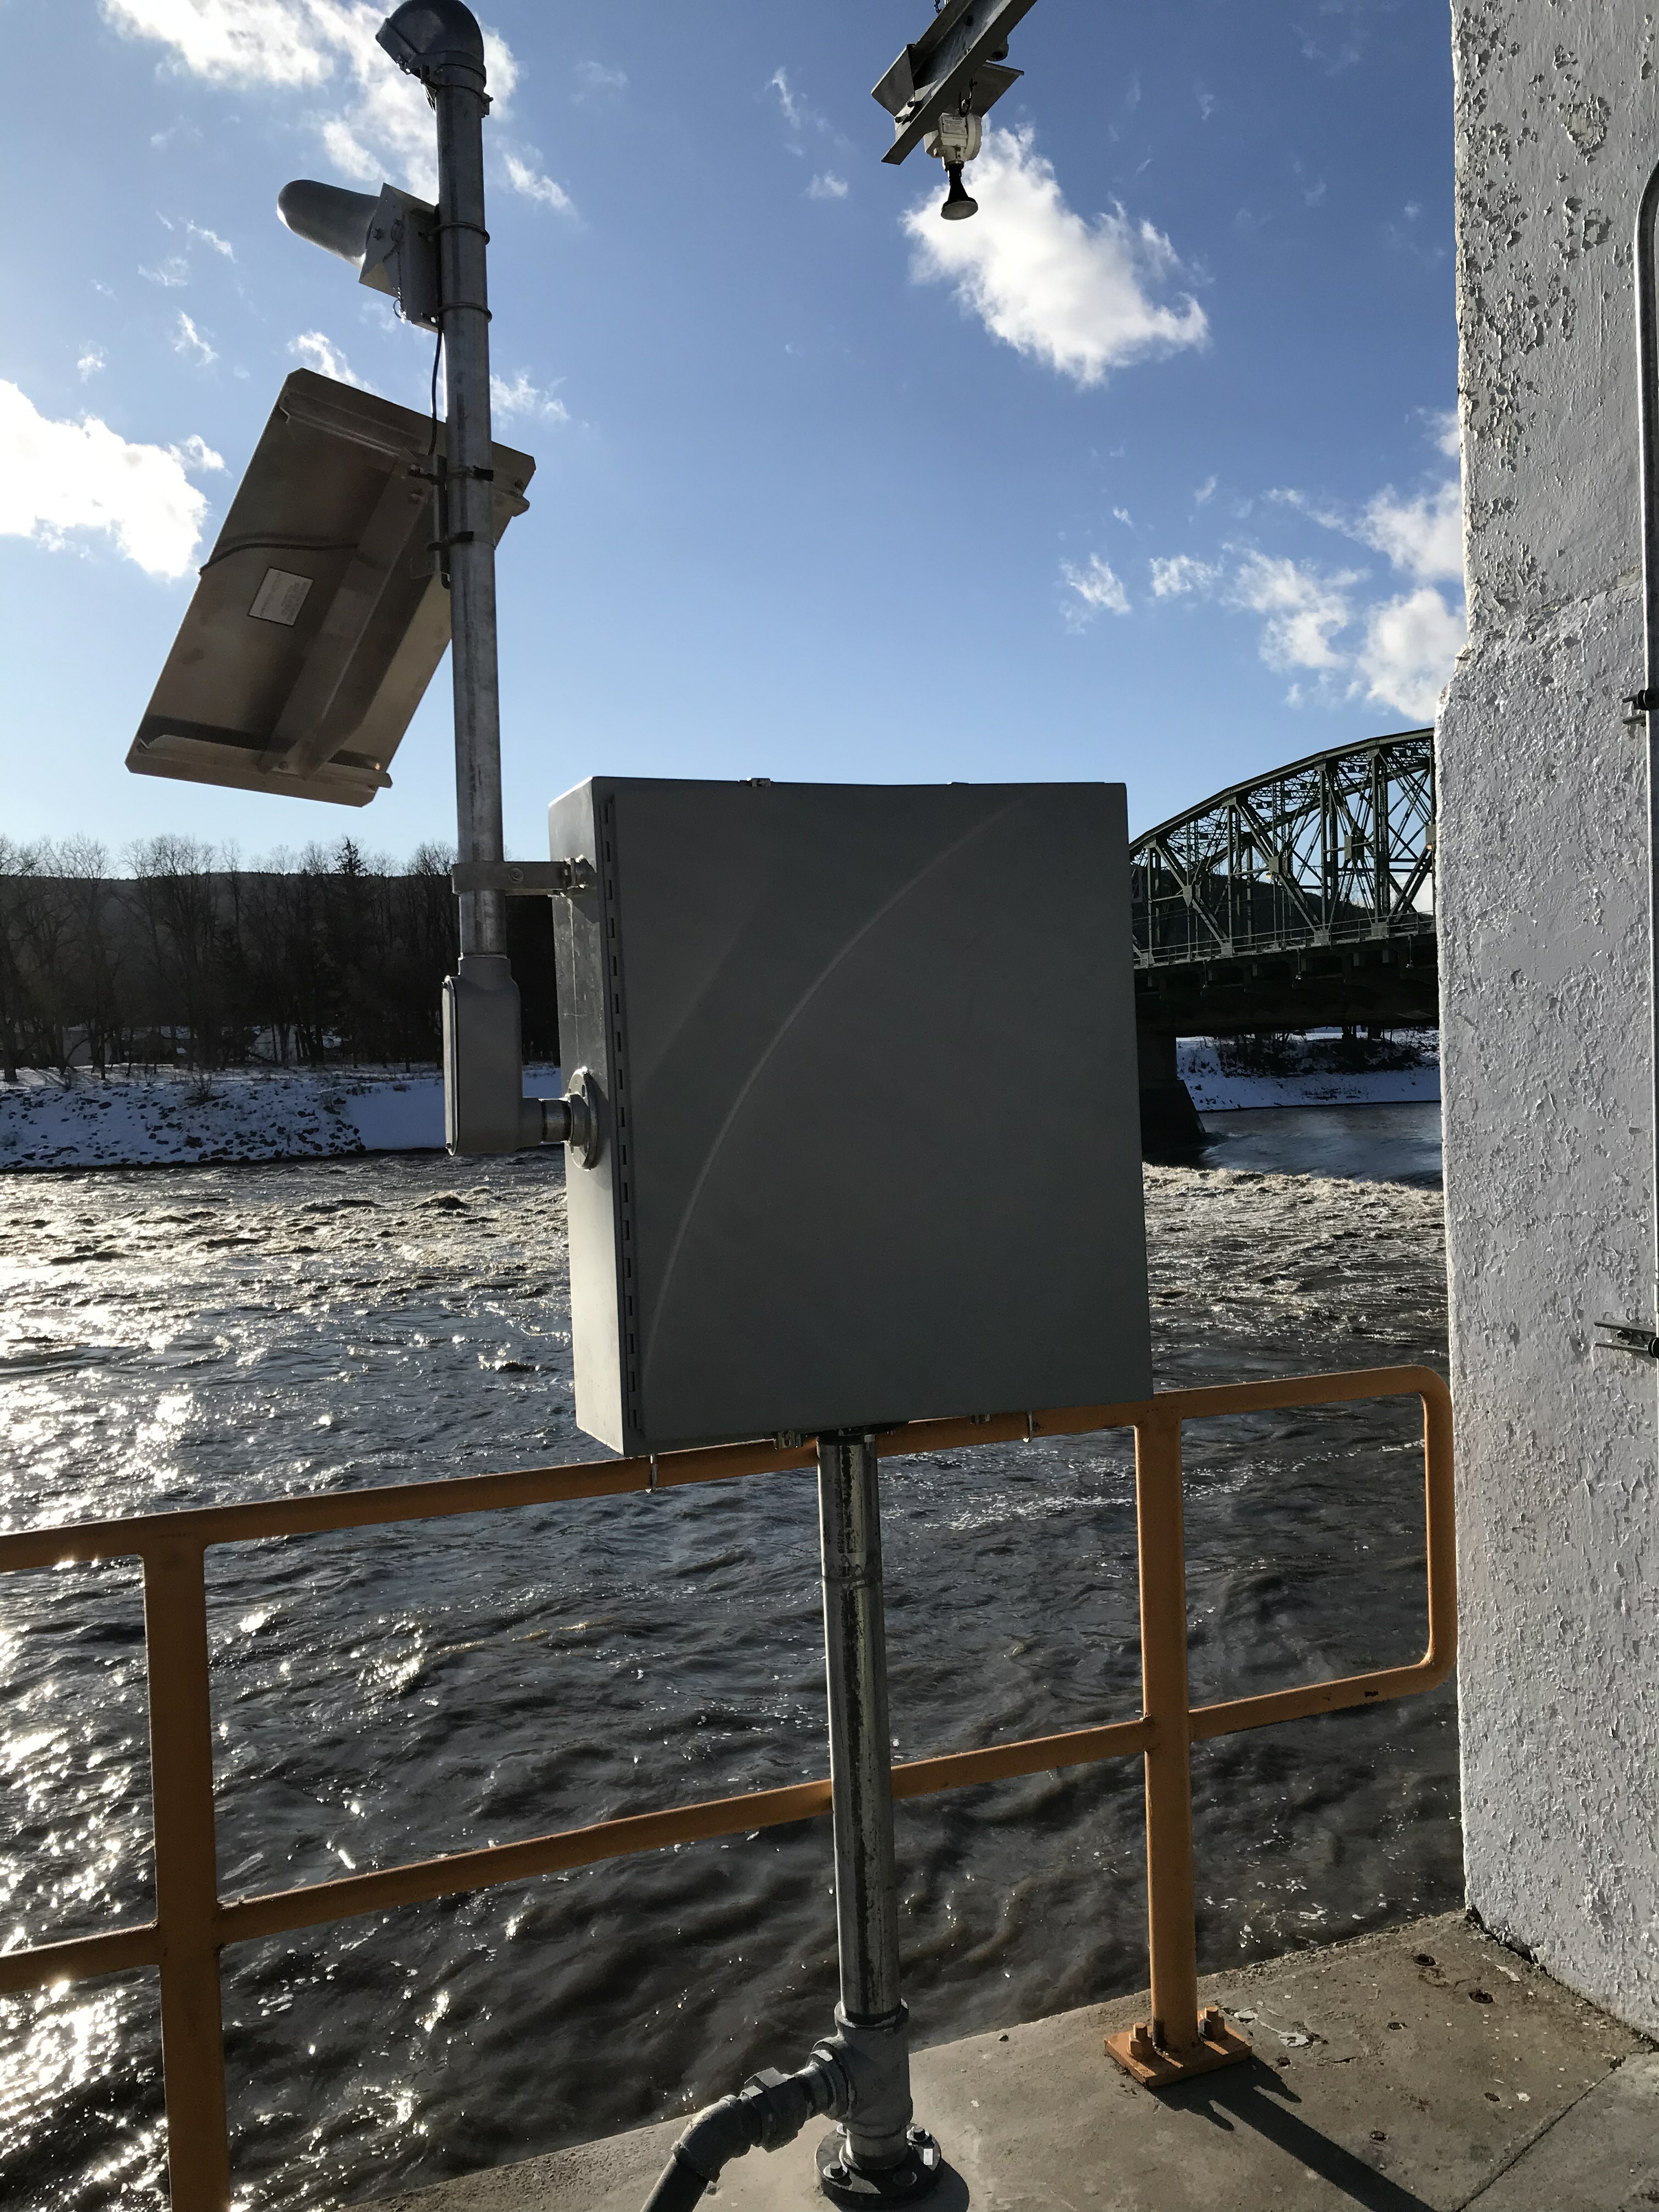 Station image
