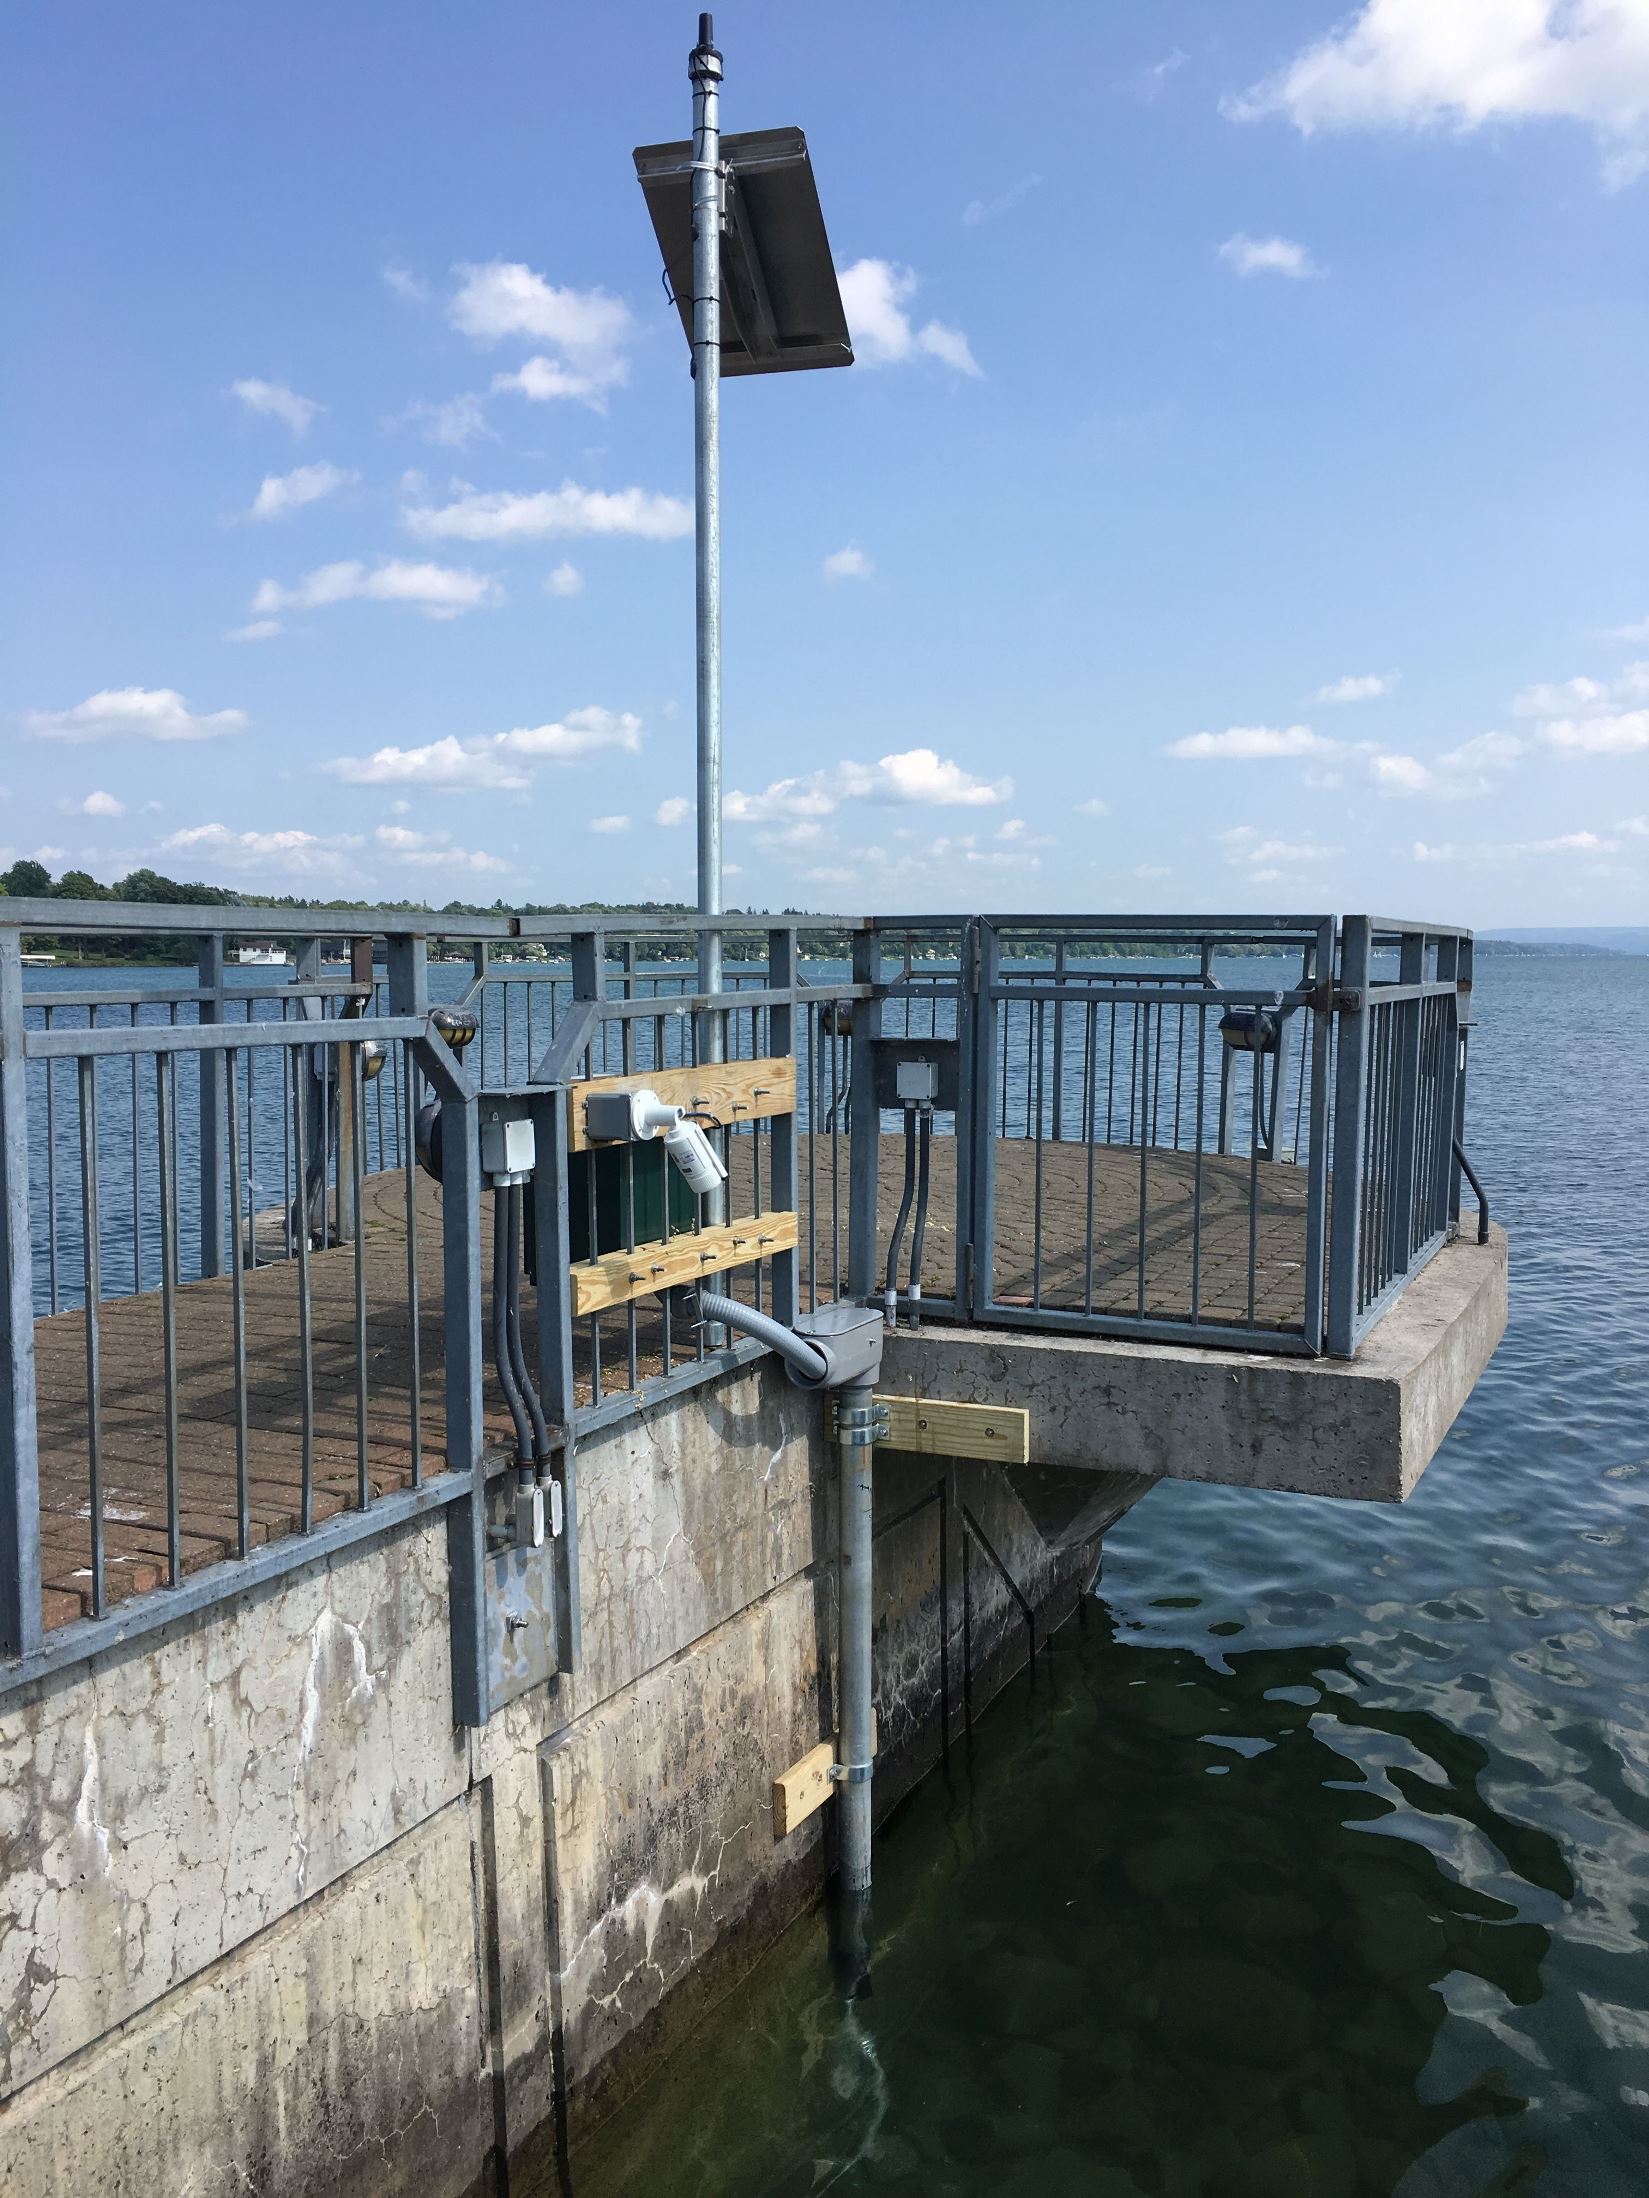
LOCATION.--Lat 42°56'41.16", long
76°25'45.09" referenced to North American Datum of
1983, Onondaga County, NY, Hydrologic Unit 04140201, on west
side of breakwater, at Skaneateles.
DRAINAGE AREA.--72.7 mi².
PERIOD OF RECORD.--October 1967 to March 1995. Records
since September 1890 collected by, and in files of, City of
Syracuse.
GAGE.--October 1967 to March 1995, nonrecording gages
read once daily by employees of Syracuse Water Division. Datum
of gage is NGVD of 1929. Gage readings from October 1967 to
September 1975 were originally published at a datum 801.75 ft
higher and have been reduced to elevations above NGVD of
1929.
COOPERATION.--Records furnished by City of
Syracuse.
REMARKS.--Lake elevation regulated by gates at outlet by
Syracuse Water Division. Area of water surface, 13.6
mi².
EXTREMES FOR PERIOD OF RECORD.--(since 1890): Maximum
observed elevation, 866.95 ft above NGVD of 1929, June 25, 26,
1972; minimum observed, 858.90 ft above NGVD of 1929, Nov. 15,
1965.
PERIOD OF RECORD1.--August 2018 to current
year (non-winter seasons only).
PERIOD OF DAILY RECORD1.--WATER TEMPERATURE:
August 2018 to current year (non-winter seasons
only).
SPECIFIC CONDUCTANCE: August 2018 to current
year (non-winter seasons only).
pH: August 2018 to current year (non-winter seasons
only).
DISSOLVED OXYGEN: August 2018 to current year (non-winter
seasons only).
TURBIDITY: August 2018 to current year (non-winter seasons
only).
CHLOROPHYLL FLUORESCENCE: December 2019 to current
year (non-winter seasons only).
PHYCOCYANIN FLUORESCENCE: December 2019 to current
year (non-winter seasons only).
DISSOLVED ORGANIC MATTER FLUORESCENCE: September 2019 to
current year (non-winter seasons only).
INSTRUMENTATION1.--A continuous water-quality
monitor with water temperature, specific conductance, pH,
dissolved oxygen, turbidity, chlorophyll fluorescence,
phycocyanin fluorescence, and dissolved organic carbon
fluorescence provides 15-minute-interval readings.
EXTREMES FOR PERIOD OF DAILY RECORD1.--WATER
TEMPERATURE: Maximum, 27.8°C, Aug. 8, 2022; minimum 2.1°C, Dec.
12, 2018.
SPECIFIC CONDUCTANCE: Maximum, 313 uS/cm @ 25°C, Dec. 4, 2018,
minimum, 256 uS/cm @ 25°C, Aug. 25, 26, 2020.
pH: Maximum, 8.8, on several days during summer periods;
minimum, 7.8, on several days during summer periods.
DISSOLVED OXYGEN: Maximum, 14.5 mg/L, May 12, 2022; minimum,
6.7 mg/L Aug. 11, 2018, Aug. 23, 2021.
TURBIDITY: Maximum, 112 FNU, Sept. 19, 2014, minimum, <0.3
FNU, on many days. [<, actual value is known to be less than
the value shown]
CHLOROPHYLL FLUORESCENCE: Maximum, 14.0 ug/L, 3.49 RFU , Aug.
19, 2020, minimum, <0.00 ug/L, <0.00 RFU on many days.
[<, actual value is known to be less than the value
shown]
PHYCOCYANIN FLUORESCENCE: Maximum, , minimum, <0.00
ug/L, <0.00 RFU on many days. [<, actual value is known
to be less than the value shown]
DISSOLVED ORGANIC CARBON FLUORESCENCE: Maximum, 16.3 QSE, 5.58
RFU, Oct. 17, 2021; minimum, 1.23 QSE, 0.48 RFU, June 2,
2021.
1 Water-Quality Records
 Site Information
 WaterAlert – get an
email or text (SMS) alert based on your chosen threshold.
 Station image
