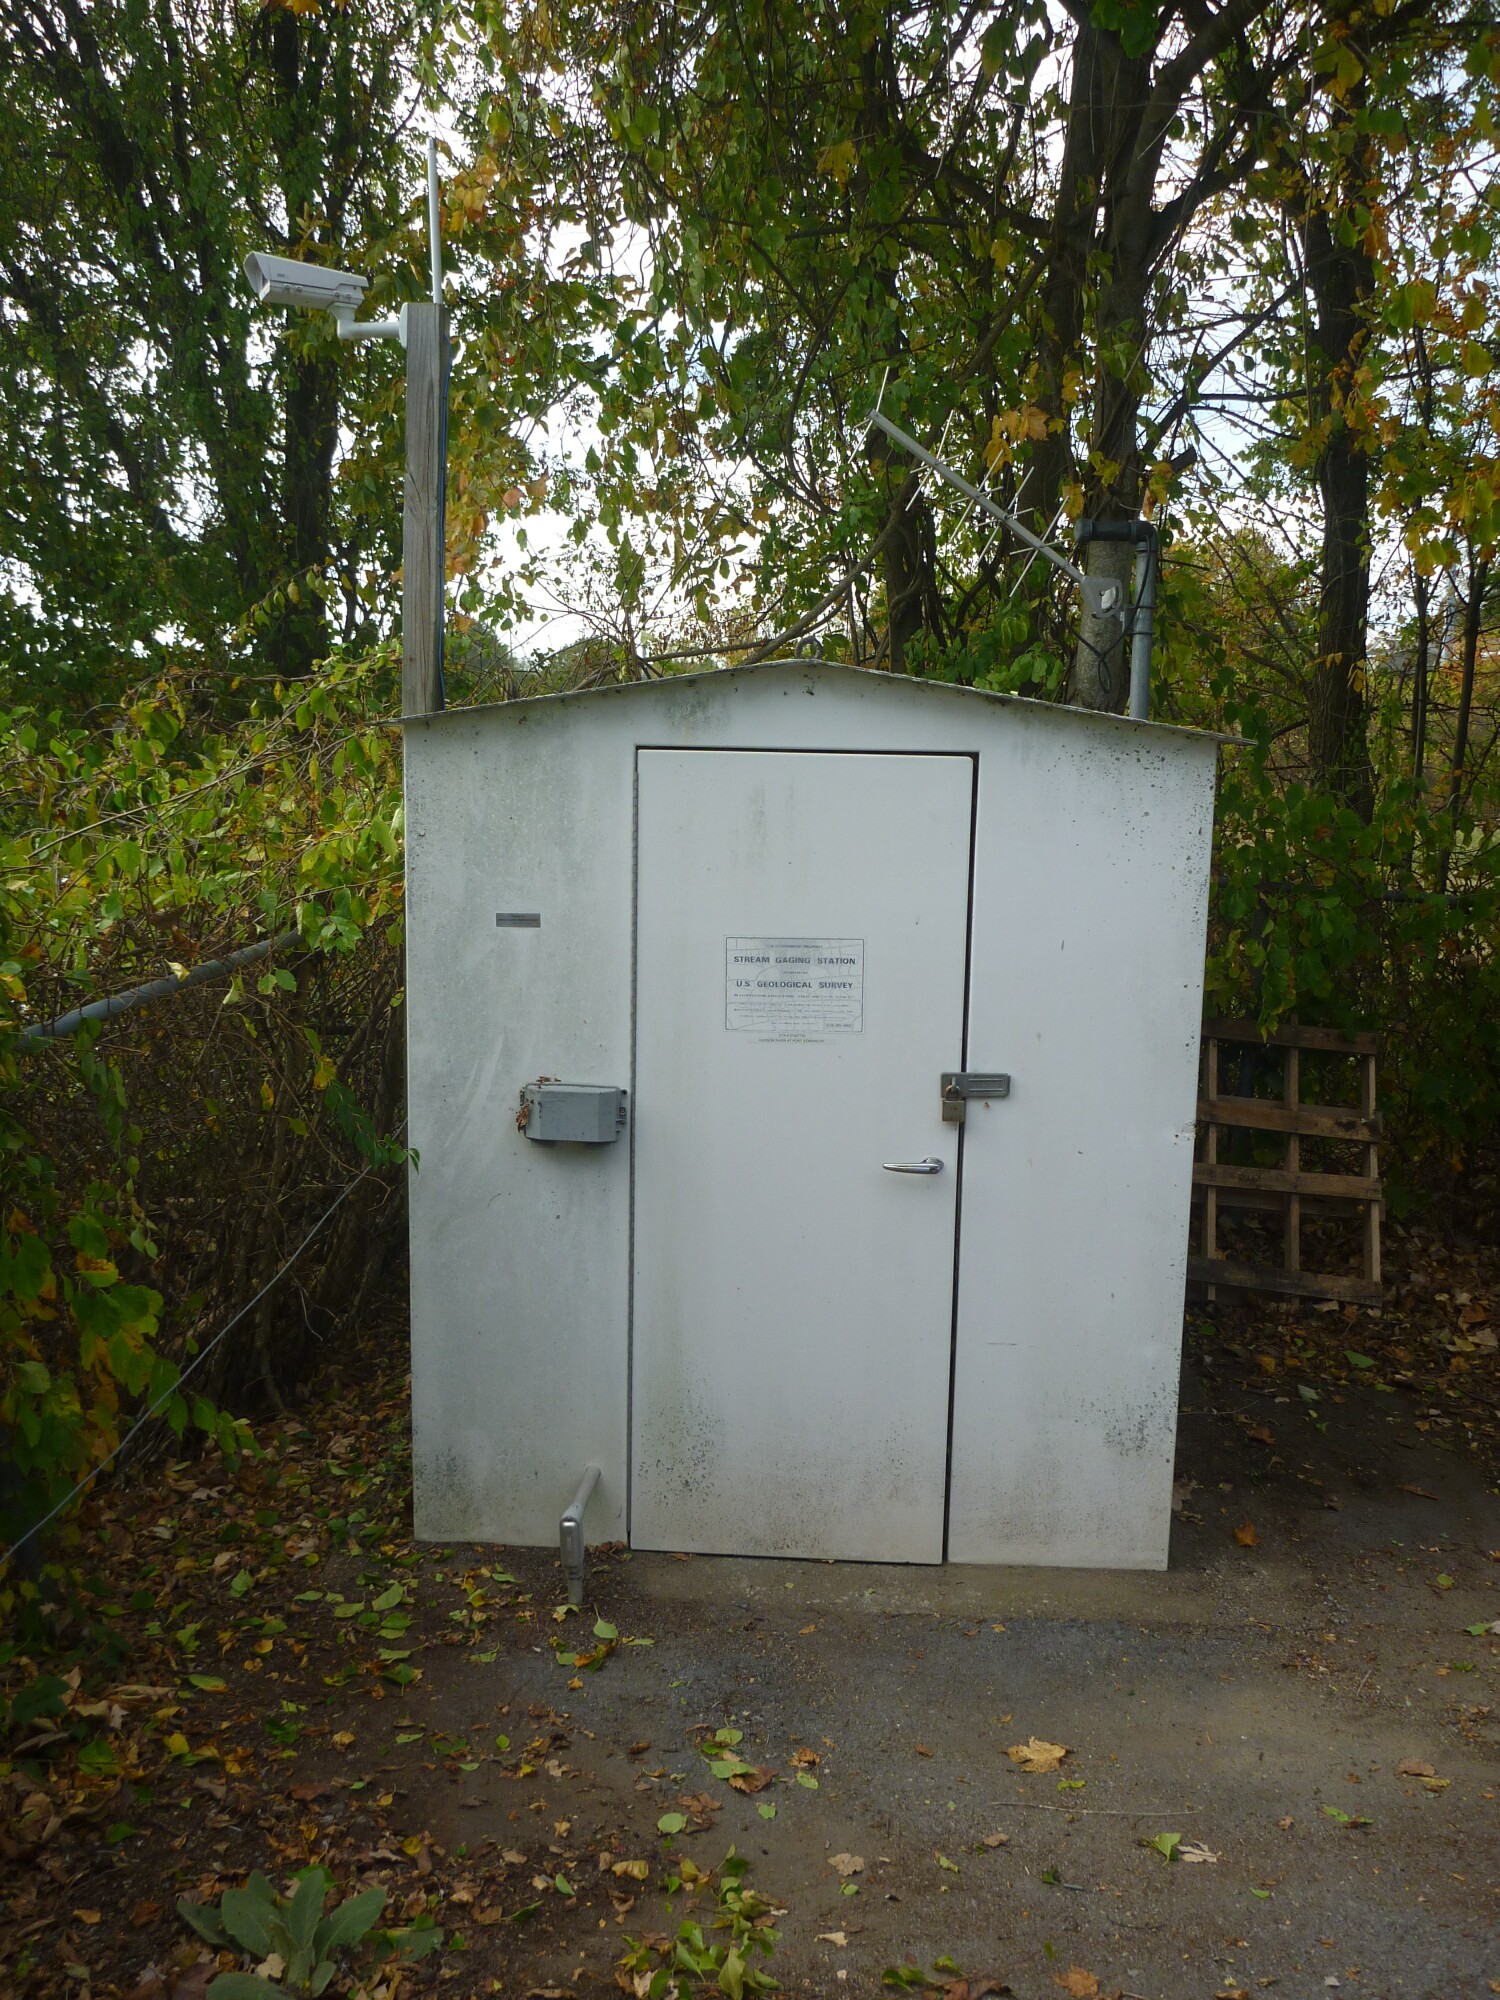
LOCATION.--Lat 43°16'09.8", long
73°35'45.0" referenced to North American Datum of
1983, Washington County, NY, Hydrologic Unit 02020003, on left
bank 40 ft upstream from Irving Paper Mill, 150 ft south of
River Street in Fort Edward, and 0.4 mi upstream from bridge on
State Highway 197.
DRAINAGE AREA.--2,810 mi².
PERIOD OF RECORD.--January 1899 to December 1908,
December 1976 to current year.
GAGE.--Water-stage recorder. Datum of gage is 100.00 ft
above NGVD of 1929 and 99.13 ft above NAVD of 1988. Prior to
December 1976, nonrecording gage at different site and
datum.
REMARKS.--Flow regulated appreciably by Great Sacandaga
Lake since March 1930 (station 01323500) and Indian Lake since
1898 (station 01314500). Diurnal fluctuation caused by
powerplants upstream from station. Water is diverted into St.
Lawrence River basin through Glens Falls feeder, Bond Creek,
and Champlain (Barge) Canal, and occasionally may be received
from that basin through summit level of Champlain (Barge) Canal
at Dunham Basin.
Water Year 2014: Records good. Water Years 2015-24: Records
fair except those for estimated daily discharges, which are
poor.
EXTREMES FOR PERIOD OF RECORD.--(December 1976 to
current year) Maximum discharge, 48,800 ft³/s, Apr. 29, 2011,
gage height, 31.34 ft; minimum discharge, 234 ft³/s, July 25,
1983; minimum gage height, 19.33 ft, Sept. 4, 1978.
EXTREMES OUTSIDE PERIOD OF RECORD.--Maximum discharge,
89,100 ft³/s, Mar. 28, 1913, at site about 14 mi upstream
(drainage area, 2,779 mi²).
 Site Information
 WaterAlert – get an
email or text (SMS) alert based on your chosen threshold.
 Station image