LOCATION.--Lat 42°55'45.3", long
74°37'58.4" referenced to North American Datum of
1983, Montgomery County, NY, Hydrologic Unit 02020004, on right
bank at downstream side of bridge on State Highway 80 at Fort
Plain, and 0.8 mi upstream from mouth.
DRAINAGE AREA.--61 mi².
PERIOD OF RECORD.--October 1949 to September 1989, July
2014 to current year.
GAGE.--Water-stage recorder and crest-stage gage. Datum
of gage is 321.98 ft above NGVD of 1929 and 321.44 ft above
NAVD of 1988. Oct. 1949 to Sept. 1989, at site 0.4 mi
downstream. Prior to Oct. 1, 1973, at datum 18.82 ft lower,
Oct. 1, 1973 to Sept. 30, 1986, at datum 19.82 ft lower, and
Oct. 1, 1986 to Sept. 30, 1989, at datum 20.82 ft lower.
REMARKS.--Water Years 2015-24: Records fair except those
for estimated daily discharges, which are poor.
EXTREMES FOR PERIOD OF RECORD.--Maximum discharge,
10,400 ft³/s, Oct. 28, 1981, gage height, 11.24 ft, site and
datum then in use, in gage well, 11.8 ft, site and datum then
in use, from floodmarks, from rating curve extended above 3,200
ft³/s on basis of contracted-opening measurement of peak flow
at present site; maximum gage height, at least 13.6 ft but less
than 13.9 ft, site and datum then in use, Jan. 26, 1989 (ice
jam); minimum discharge, 0.6 ft³/s, Nov. 30, 1964.
EXTREMES OUTSIDE PERIOD OF RECORD.--Flood of June 28,
2013, reached a stage of 17.52 ft, present site and datum, from
floodmarks, 19.60 ft, former site and datum, from floodmarks,
discharge, 24,600 ft³/s, on basis of runoff comparison of peak
flow from slope-area measurement at site 2.3 mi upstream.
 Site Information
 WaterAlert – get an
email or text (SMS) alert based on your chosen threshold.
WaterAlert – get an
email or text (SMS) alert based on your chosen threshold.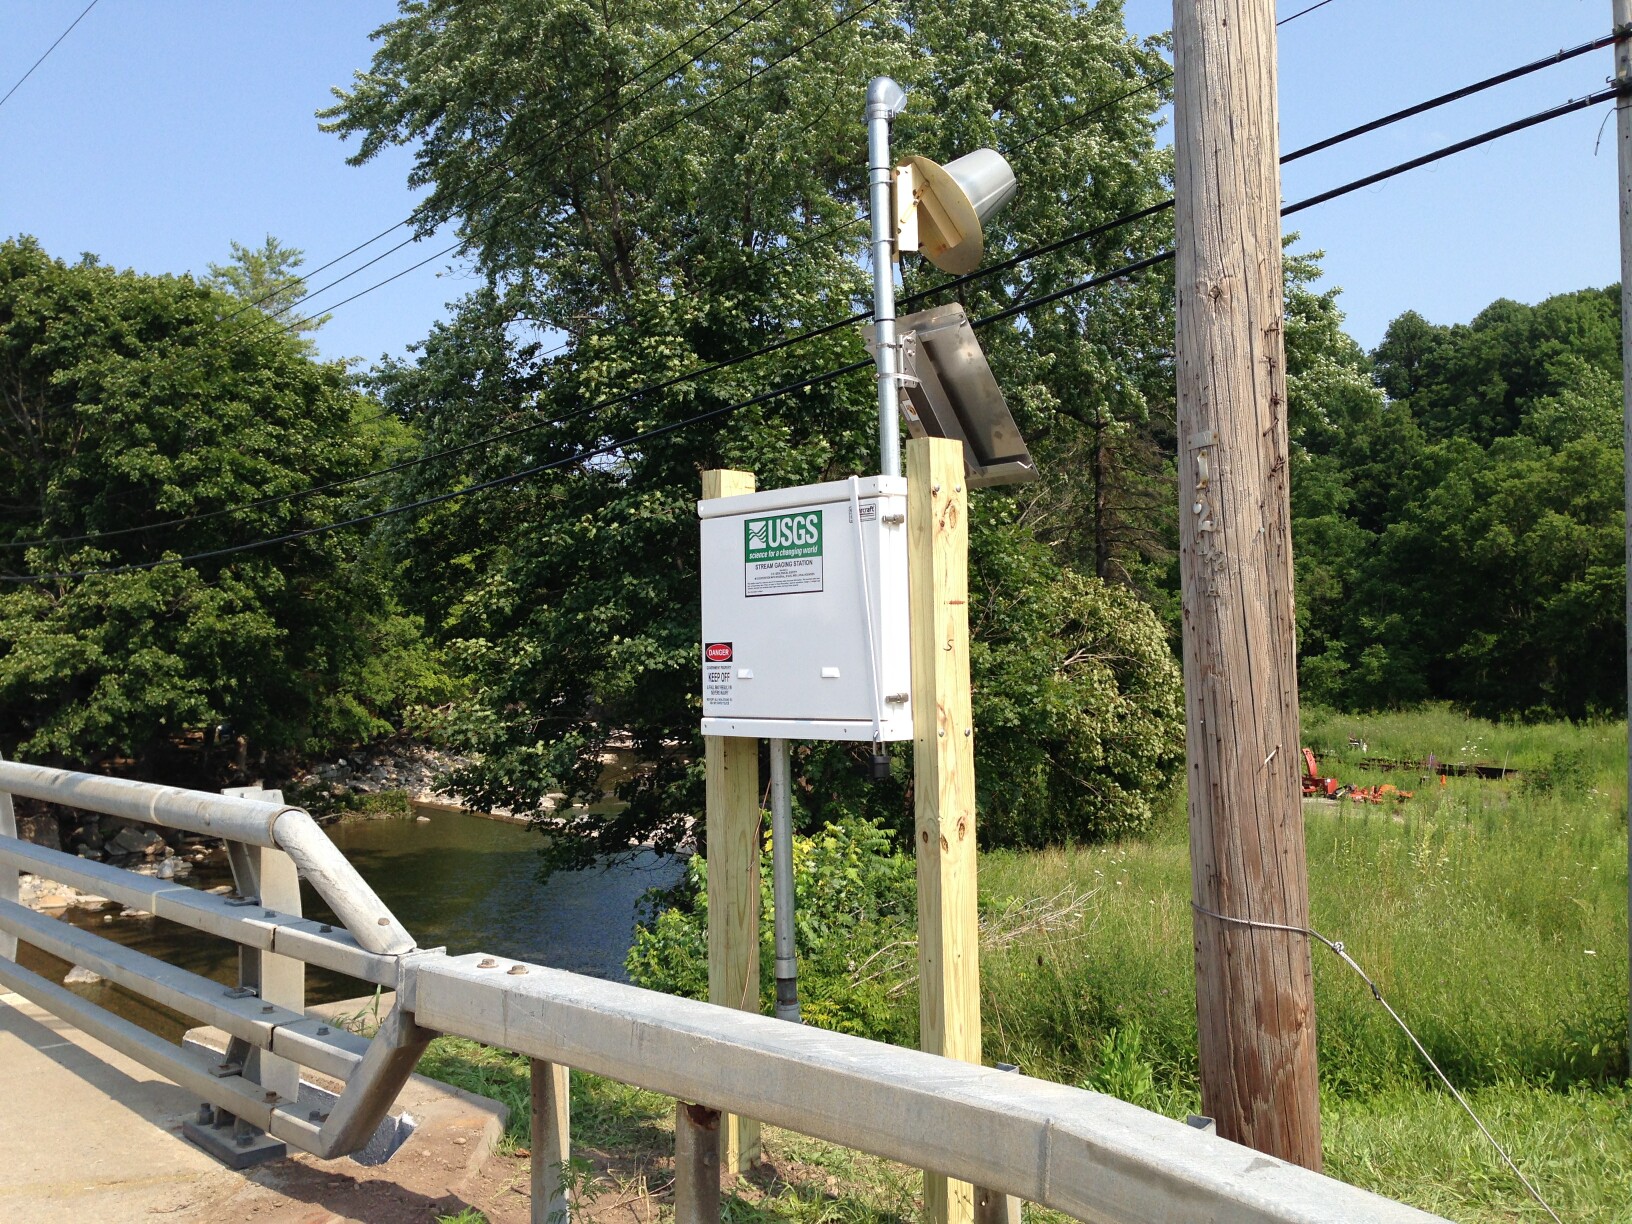 Station image