Warning: Javascript must be enabled to use all the features on this page!


Page Loading - Please Wait...

Click to hideNews Bulletins

USGS 01451630 Cedar Creek at Mouth near Allentown, PA

PROVISIONAL DATA SUBJECT TO REVISION

Click to hidestation-specific text
Funding for this site is provided by:


Station gage imageSTATION.--01451630 CEDAR CREEK AT MOUTH NEAR ALLENTOWN, PA
LOCATION.--Lat 40`35'15", long 75`29'48", Lehigh County, Hydrologic Unit 02040106, on right bank, 200 ft upstream of Martin Luther King Jr Drive, 2000 ft upstream of confluence with Little Lehigh Creek.
DRAINAGE AREA.--14.5 square miles.
PERIOD OF RECORD.--January 2020 to current year.
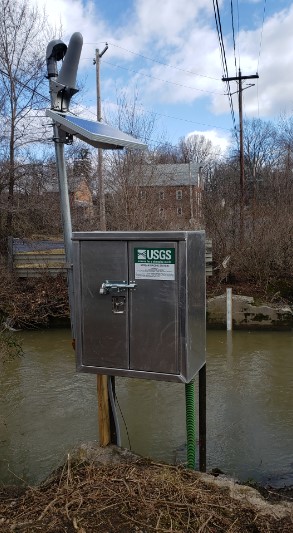
GAGE.--Water-stage recorder, crest-stage gage, and water-quality monitor. Datum of gage is 257.6 ft above North American Vertical Datum of 1988. Satellite telemetry at station. Prior to November 7, 2022, the datum of gage was erroneously reported as 258 ft above NAVD88.
COOPERATION.--Station established and maintained by the U.S. Geological Survey. Funding for the operation of this station is provided by the U.S. Geological Survey.
GAGE HEIGHTS OF IMPORTANCE.-
Supplied by USGS: Maximum recordable gage height (stage sensor operational limit): 10.10 ft; Minimum recordable gage height (orifice): 0.37 ft.
This station managed by the PAWSC Downingtown Field Office.

Available Parameters Period of Record
  
2020-01-17  2024-04-23
2020-01-17  2024-04-23
2020-01-17  2024-04-23


 (365)
 

  -- or --


Summary of all available data for this site
Instantaneous-data availability statement


Temperature, water, degrees Celsius


Graph of DAILY Temperature, water, degrees Celsius

Add up to 2 more sites and replot for "Temperature, water, degrees Celsius"

?


Create presentation-quality graph.  


Discharge, cubic feet per second


Graph of DAILY Discharge, cubic feet per second

Add up to 2 more sites and replot for "Discharge, cubic feet per second"

?


Create presentation-quality graph.  


Specific conductance, water, unfiltered, microsiemens per centimeter at 25 degrees Celsius


Graph of DAILY Specific conductance, water, unfiltered, microsiemens per centimeter at 25 degrees Celsius

Add up to 2 more sites and replot for "Specific conductance, water, unfiltered, microsiemens per centimeter at 25 degrees Celsius"

?


Create presentation-quality graph.