LOCATION.--Lat 40°44'35.8", long 95°00'51.1"
referenced to North American Datum of 1983, in SE 1/4 SE 1/4 SW 1/4
sec.29, T.69 N., R.36 W., Page County, IA, Hydrologic Unit 10240009,
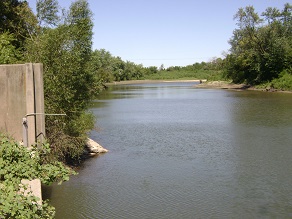
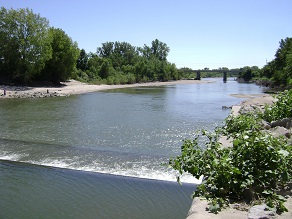
on right bank 500 ft upstream from dam, at eastern edge of Clarinda,
1300 ft downstream from North Branch, 7.8 mi upstream from East
Nodaway River, and 12.3 mi upstream from Iowa-Missouri state line.
(map)
DRAINAGE AREA.--762 mi2.
SURFACE-WATER RECORDS
PERIOD OF RECORD.--Discharge records from May 1918 to July 1925
(no winter records), May 1936 to current year. May 1918 to July 1925,
monthly mean discharge for some periods published in WSP 1310.
REVISED RECORDS.--WSP 1240: 1918-20 (M), 1921, 1922-25 (M),
1936-38, 1942, 1943-45 (M), 1948. WSP 1440: Drainage area. WSP 1710:
1958, 1959 (P).
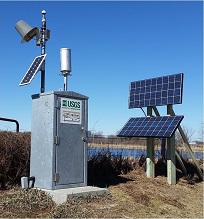
GAGE.--Water-stage recorder. Datum of gage is 955.36 ft above
National Geodetic Vertical Datum of 1929. Prior to July 5, 1925, and
May 28, 1936, to March 26, 1957, non-recording gage, and March 27,
1957, to September 30, 2010, water-stage recorder, all at site 1,500
ft downstream and 1,000 ft below dam. Prior to October 1, 1987, at
datum 5.00 ft higher.
COOPERATION.--Average pumpage provided by Clarinda Water Treatment
Plant.
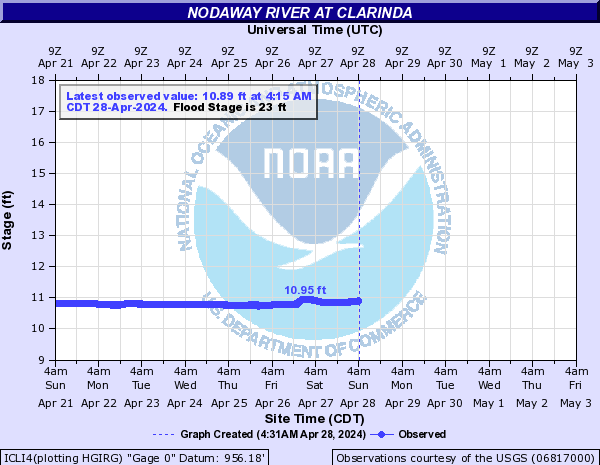
REMARKS.--Clarinda municipal water supply is withdrawn from
Nodaway River, 500 ft downstream from gage. Average daily pumpage was
1.77 ft3/s.
WATER-QUALITY RECORDS
PERIOD OF RECORD.--Water years 1977-1992, 2008.
PERIOD OF DAILY RECORD.--
NITRATE + NITRITE: May to September 2012.
WATER TEMPERATURE: September 2012.
 Site Information