USGS 15008000 SALMON R NR HYDER AK

PROVISIONAL DATA SUBJECT TO REVISION

Click to hidestation-specific text

Boating safety tips

HTML5 Icon

This station is operated in cooperation with:

Alaska Department of Transportation & Public Facilities

This station managed by the Juneau Field Office.

Available Parameters Available Period
  
2020-03-14  2025-09-03
2022-11-09  2025-10-03
2023-06-22  2025-10-03
2022-10-20  2025-10-03
2023-06-22  2025-09-03
2023-06-22  2025-10-03
2009-10-20  2025-10-03
2009-10-19  2025-10-03
2020-03-14  2025-09-03
2022-10-02  2025-10-03
2020-03-14  2025-09-03
2020-03-14  2025-09-03
2022-11-09  2025-10-03
2022-10-02  2025-09-03
2020-03-14  2025-09-03


 (7)
 

  -- or --


Summary of all available data for this site
Instantaneous-data availability statement

Temperature, water, degrees Celsius, Primary
 
-- Data temporarily unavailable for the time period specified --


Temperature, water, degrees Celsius, Secondary, [Secondary]

Most recent instantaneous value: 3.6 10-03-2025   02:00 AKDT
Graph of  Temperature, water, degrees Celsius, [Secondary]

Add up to 2 more sites and replot for "Temperature, water, degrees Celsius, Secondary, [Secondary]"

?


Create presentation-quality / stand-alone graph.   Subscribe to WaterAlert      

See this graph on the Monitoring Location Pages


Temperature, air, degrees Celsius

Most recent instantaneous value: 7.6 10-03-2025   02:00 AKDT
Graph of  Temperature, air, degrees Celsius

Add up to 2 more sites and replot for "Temperature, air, degrees Celsius"

?


Create presentation-quality / stand-alone graph.   Subscribe to WaterAlert      

See this graph on the Monitoring Location Pages


Wind speed, miles per hour

Most recent instantaneous value: 0.3 10-03-2025   02:00 AKDT
Graph of  Wind speed, miles per hour

Add up to 2 more sites and replot for "Wind speed, miles per hour"

?


Create presentation-quality / stand-alone graph.   Subscribe to WaterAlert      

See this graph on the Monitoring Location Pages


Wind direction, degrees clockwise from true north
 
-- Data temporarily unavailable for the time period specified --


Precipitation, total, inches

Most recent instantaneous value: 0.10 10-03-2025   02:00 AKDT
Graph of  Precipitation, total, inches

Add up to 2 more sites and replot for "Precipitation, total, inches"

?


Create presentation-quality / stand-alone graph.   Subscribe to WaterAlert      

See this graph on the Monitoring Location Pages


Discharge, cubic feet per second

Most recent instantaneous value: 354 10-03-2025   02:45 AKDT
Graph of  Discharge, cubic feet per second

Add up to 2 more sites and replot for "Discharge, cubic feet per second"

?


Create presentation-quality / stand-alone graph.   Subscribe to WaterAlert      

See this graph on the Monitoring Location Pages


Daily discharge, cubic feet per second -- statistics for Oct 3 based on 26 water years of record more
Min
(2010)
Most Recent
Instantaneous
Value Oct 3
25th
percen-
tile
Median Mean 75th
percen-
tile
Max
(2015)
340 354 758 981 1270 1810 3480


Gage height, feet, [Primary]

Most recent instantaneous value: 16.60 10-03-2025   02:45 AKDT
Graph of  Gage height, feet, [Primary]

Add up to 2 more sites and replot for "Gage height, feet, [Primary]"
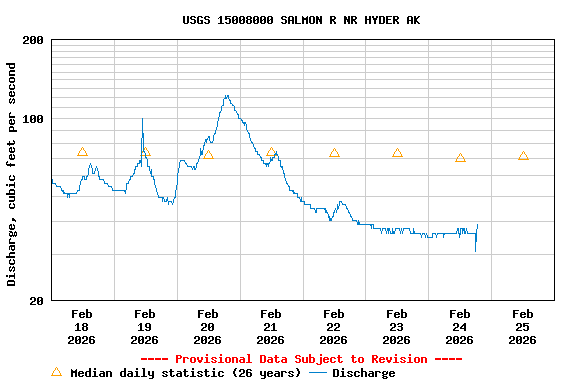
?


Create presentation-quality / stand-alone graph.   Subscribe to WaterAlert      

See this graph on the Monitoring Location Pages


Specific conductance, water, unfiltered, microsiemens per centimeter at 25 degrees Celsius, Primary
 
-- Data temporarily unavailable for the time period specified --


Specific conductance, water, unfiltered, microsiemens per centimeter at 25 degrees Celsius, Secondary, [Secondary]

Most recent instantaneous value: 104 10-03-2025   02:00 AKDT
Graph of  Specific conductance, water, unfiltered, microsiemens per centimeter at 25 degrees Celsius, [Secondary]

Add up to 2 more sites and replot for "Specific conductance, water, unfiltered, microsiemens per centimeter at 25 degrees Celsius, Secondary, [Secondary]"

?


Create presentation-quality / stand-alone graph.   Subscribe to WaterAlert      

See this graph on the Monitoring Location Pages


Dissolved oxygen, water, unfiltered, milligrams per liter, Primary
 
-- Data temporarily unavailable for the time period specified --

pH, water, unfiltered, field, standard units, Primary
 
-- Data temporarily unavailable for the time period specified --


pH, water, unfiltered, field, standard units, Secondary, [Secondary]

Most recent instantaneous value: 8.0 10-03-2025   02:00 AKDT
Graph of  pH, water, unfiltered, field, standard units, [Secondary]

Add up to 2 more sites and replot for "pH, water, unfiltered, field, standard units, Secondary, [Secondary]"

?


Create presentation-quality / stand-alone graph.   Subscribe to WaterAlert      

See this graph on the Monitoring Location Pages


Dissolved organic matter fluorescence (fDOM), water, in situ, concentration estimated from reference material, micrograms per liter as quinine sulfate equivalents (QSE)
 
-- Data temporarily unavailable for the time period specified --

Turbidity, water, unfiltered, monochrome near infra-red LED light, 780-900 nm, detection angle 90 +-2.5 degrees, formazin nephelometric units (FNU), Primary
 
-- Data temporarily unavailable for the time period specified --