Warning: Javascript must be enabled to use all the features on this page!


Page Loading - Please Wait...

Click to hideNews Bulletins
! This page is undergoing modernization with expected decommissioning as key features are added to the modernized pages.
Learn more about our modernization plans to find out which options will suit you best. Next Generation Monitoring Location Page is available now.

USGS 01343403 BLACK CREEK NEAR GRAY NY

PROVISIONAL DATA SUBJECT TO REVISION

Click to hidestation-specific text


> Site Information
LOCATION.--Lat 43°16'58.0", long 74°57'33.1" referenced to North American Datum of 1983, Herkimer County, NY, Hydrologic Unit 02020004, on right bank 15 ft upstream from bridge on Reinhart Road, 1.3 mi upstream of State Highway 8 bridge, and 1.4 mi northwest of Gray.
DRAINAGE AREA.--60.9 mi².
PERIOD OF RECORD.--August 2014 to current year.
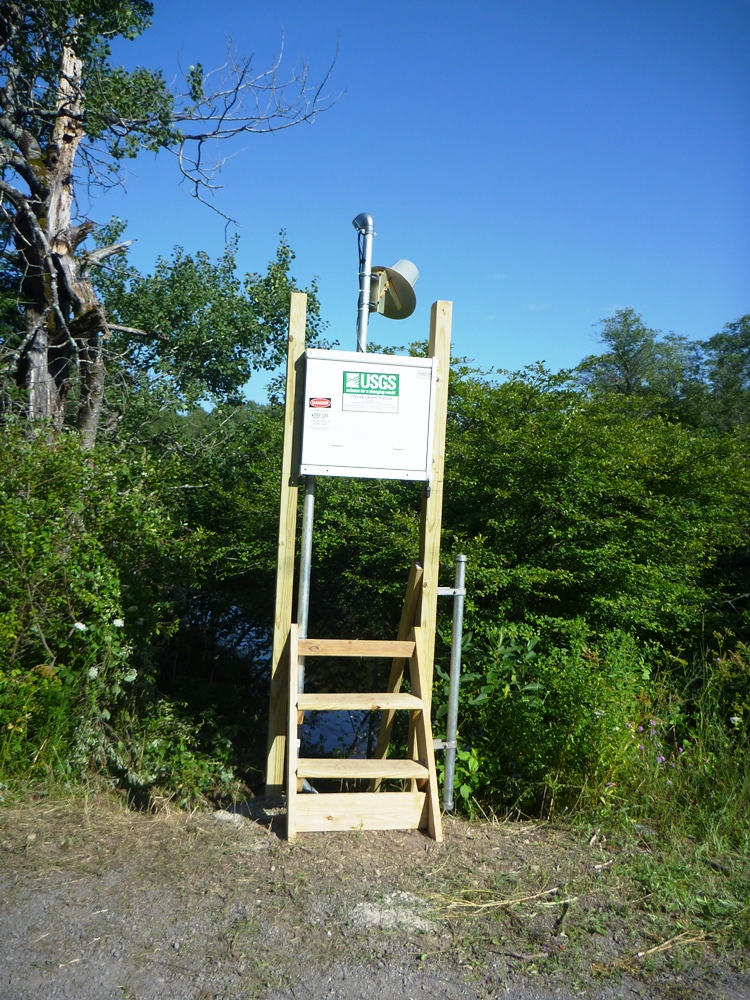
GAGE.--Water-stage recorder and crest-stage gage. Datum of gage is 1,224.74 ft above NAVD of 1988.
REMARKS.--Water Years 2015-23: Records fair except those for estimated daily discharges and those above 6,000 ft³/s, which are poor.
EXTREMES FOR PERIOD OF RECORD.--Maximum discharge, about 14,700 ft³/s, Nov. 1, 2019, gage height, 23.72 ft, from flood mark, from rating curve extended above 6,000 ft³/s; minimum discharge, 9.0 ft³/s, Sept. 12, 13, 23, 27, 28, 2020, gage height, 3.81 ft.
EXTREMES OUTSIDE PERIOD OF RECORD.--Outstanding floods occurred in August and September 2011. Flood in August or September 2011 reached a stage of about 19.9 ft, discharge not determined, from information by local resident.
> Rating Information
This station managed by the NY Water Science Center Troy.

Available Parameters Available Period
  
2014-08-09  2024-07-27
2014-08-08  2024-07-27


 (7)
 

  -- or --


Summary of all available data for this site
Instantaneous-data availability statement


Discharge, cubic feet per second

Most recent instantaneous value: 32.0 07-27-2024   11:15 EST
Graph of  Discharge, cubic feet per second

Add up to 2 more sites and replot for "Discharge, cubic feet per second"

?


Create presentation-quality / stand-alone graph.   Subscribe to WaterAlert      

See this graph on the Monitoring Location Pages


Daily discharge, cubic feet per second -- statistics for Jul 27 based on 9 water years of record more
Min
(2020)
25th
percen-
tile
Most Recent
Instantaneous
Value Jul 27
Median Mean 75th
percen-
tile
Max
(2017)
20.8 30 32.0 45 52 82 101


Gage height, feet

Most recent instantaneous value: 4.33 07-27-2024   11:15 EST
Graph of  Gage height, feet

Add up to 2 more sites and replot for "Gage height, feet"

?


Create presentation-quality / stand-alone graph.   Subscribe to WaterAlert      

See this graph on the Monitoring Location Pages