LOCATION.--Lat 42°52'34.6", long
74°36'10.3" referenced to North American Datum of
1983, Montgomery County, NY, Hydrologic Unit 02020004, on right
bank 10 ft upstream from bridge on McEwan Road, and 2.3 mi
southwest of Canajoharie.
DRAINAGE AREA.--59.7 mi².
PERIOD OF RECORD.--March 1993 to current year.
REVISIONS HISTORY.--Gage height for the period Aug. 16,
2017 to Sept. 30, 2017, was revised on May 8, 2018, based on
changes to the sensor location. Discharge for the period of
Aug. 7, 2017 to Sept. 30, 2017, was revised on May 8, 2018,
based on changes to the stage-discharge rating. Discharge
for the period Nov. 3, 2016 to Oct. 2, 2024, was revised on
Dec. 13, 2024, based on changes to the stage-discharge
rating.
GAGE.--Water-stage recorder and crest-stage gage. Datum
of gage is 635.23 ft above NAVD of 1988. Apr. 27, 2016 to
Aug. 16, 2017, at temporary site 110 ft downstream at
present datum during period of bridge
reconstruction.
REMARKS.--Water Years 2014-23: Records good except those
for estimated daily discharges, which are poor. Water Year
2024: Records fair except those for estimated daily discharges,
which are poor.
EXTREMES FOR PERIOD OF RECORD.--Maximum discharge, 5,850
ft³/s, Aug. 28, 2011, gage height, 10.76 ft; minimum discharge,
0.23 ft³/s, Aug. 27, 28, 29, 1995, gage height, 1.26 ft;
minimum gage height, 1.21 ft, Sept. 10, 2015, Aug. 16, 18,
2022.
PERIOD OF DAILY RECORD1.--WATER TEMPERATURE:
March 1993 to September 2000.
EXTREMES FOR PERIOD OF DAILY RECORD1.--WATER
TEMPERATURE: Maximum, 37.0°C, July 15, 1995; minimum, 0.0°C on
many days during winter periods.
1 Water-Quality Records
 Site Information
 WaterAlert – get an
email or text (SMS) alert based on your chosen threshold.
WaterAlert – get an
email or text (SMS) alert based on your chosen threshold.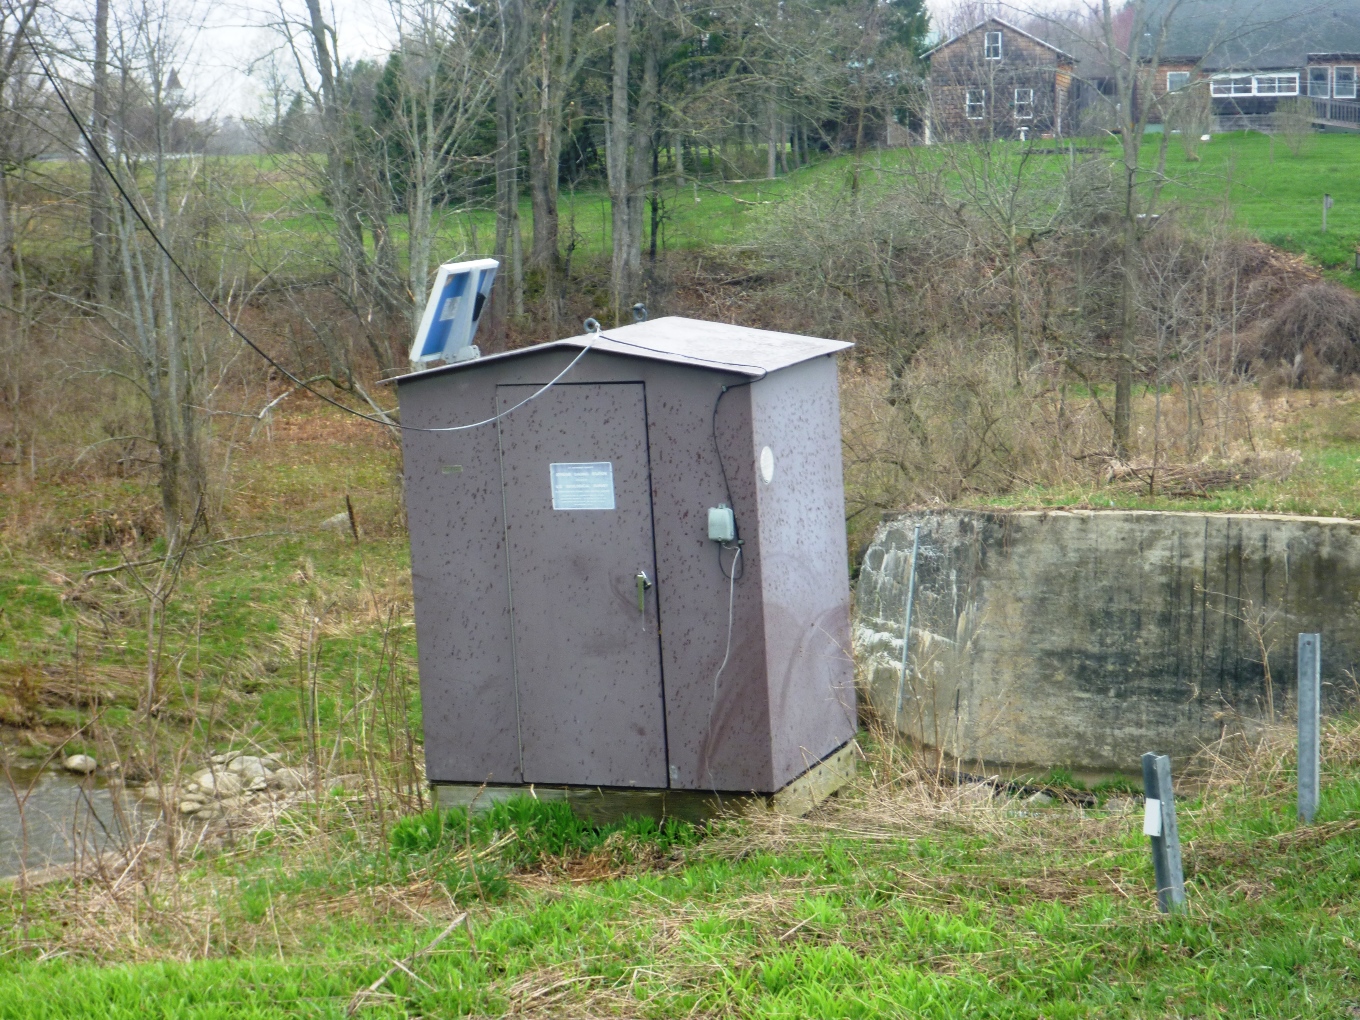 Station image
