LOCATION.--Lat 42°56'02.4", long
74°11'30.7" referenced to North American Datum of
1983, Montgomery County, NY, Hydrologic Unit 02020004, on left
bank in waterfront park at Amsterdam, and 480 ft downstream
from bridge on State Highway 30.
DRAINAGE AREA.--3,152 mi².
PERIOD OF RECORD.--Miscellaneous discharge measurements,
water years 1966-67. January 2015 to current year.
GAGE.--Water-stage recorder, acoustic velocity meter,
and crest-stage gage. Datum of gage is 234.50 ft above NAVD of
1988.
REMARKS.--Considerable regulation of stage by Lock 11 on
the Erie (Barge) Canal about 1.3 mi upstream and Lock 10 on the
Erie (Barge) Canal about 3.0 mi downstream.
Water Years 2015-24: Records poor.
EXTREMES FOR PERIOD OF RECORD.--Maximum discharge 89,600
ft³/s, Apr. 8, 2022, gage height, 25.49 ft; minimum discharge
not determined; minimum gage height, 7.56 ft, June 27,
2020.
EXTREMES OUTSIDE PERIOD OF RECORD.--Flood of Aug. 29,
2011, reached a stage of 41.94 ft, from floodmarks in
downstream cabin of Lock 11 about 1.3 mi upstream, and a stage
of 35.70 ft, from floodmarks in upstream cabin of Lock 10 about
3.0 mi downstream, from information provided by New York State
Canal Corporation. Flood of June 29, 2006, reached stages of
38.18 ft and 28.92 ft, from floodmarks at same locations
respectively.
PERIOD OF DAILY RECORD1.--WATER TEMPERATURE:
December 2021 to current year.
EXTREMES FOR PERIOD OF DAILY RECORD1.--WATER
TEMPERATURE: Maximum, 27.4 °C, Aug. 9, 2022; minimum, -0.1
°C, on several days in winter 2022.
1 Water-Quality Records
 Site Information
 WaterAlert – get an
email or text (SMS) alert based on your chosen threshold.
WaterAlert – get an
email or text (SMS) alert based on your chosen threshold.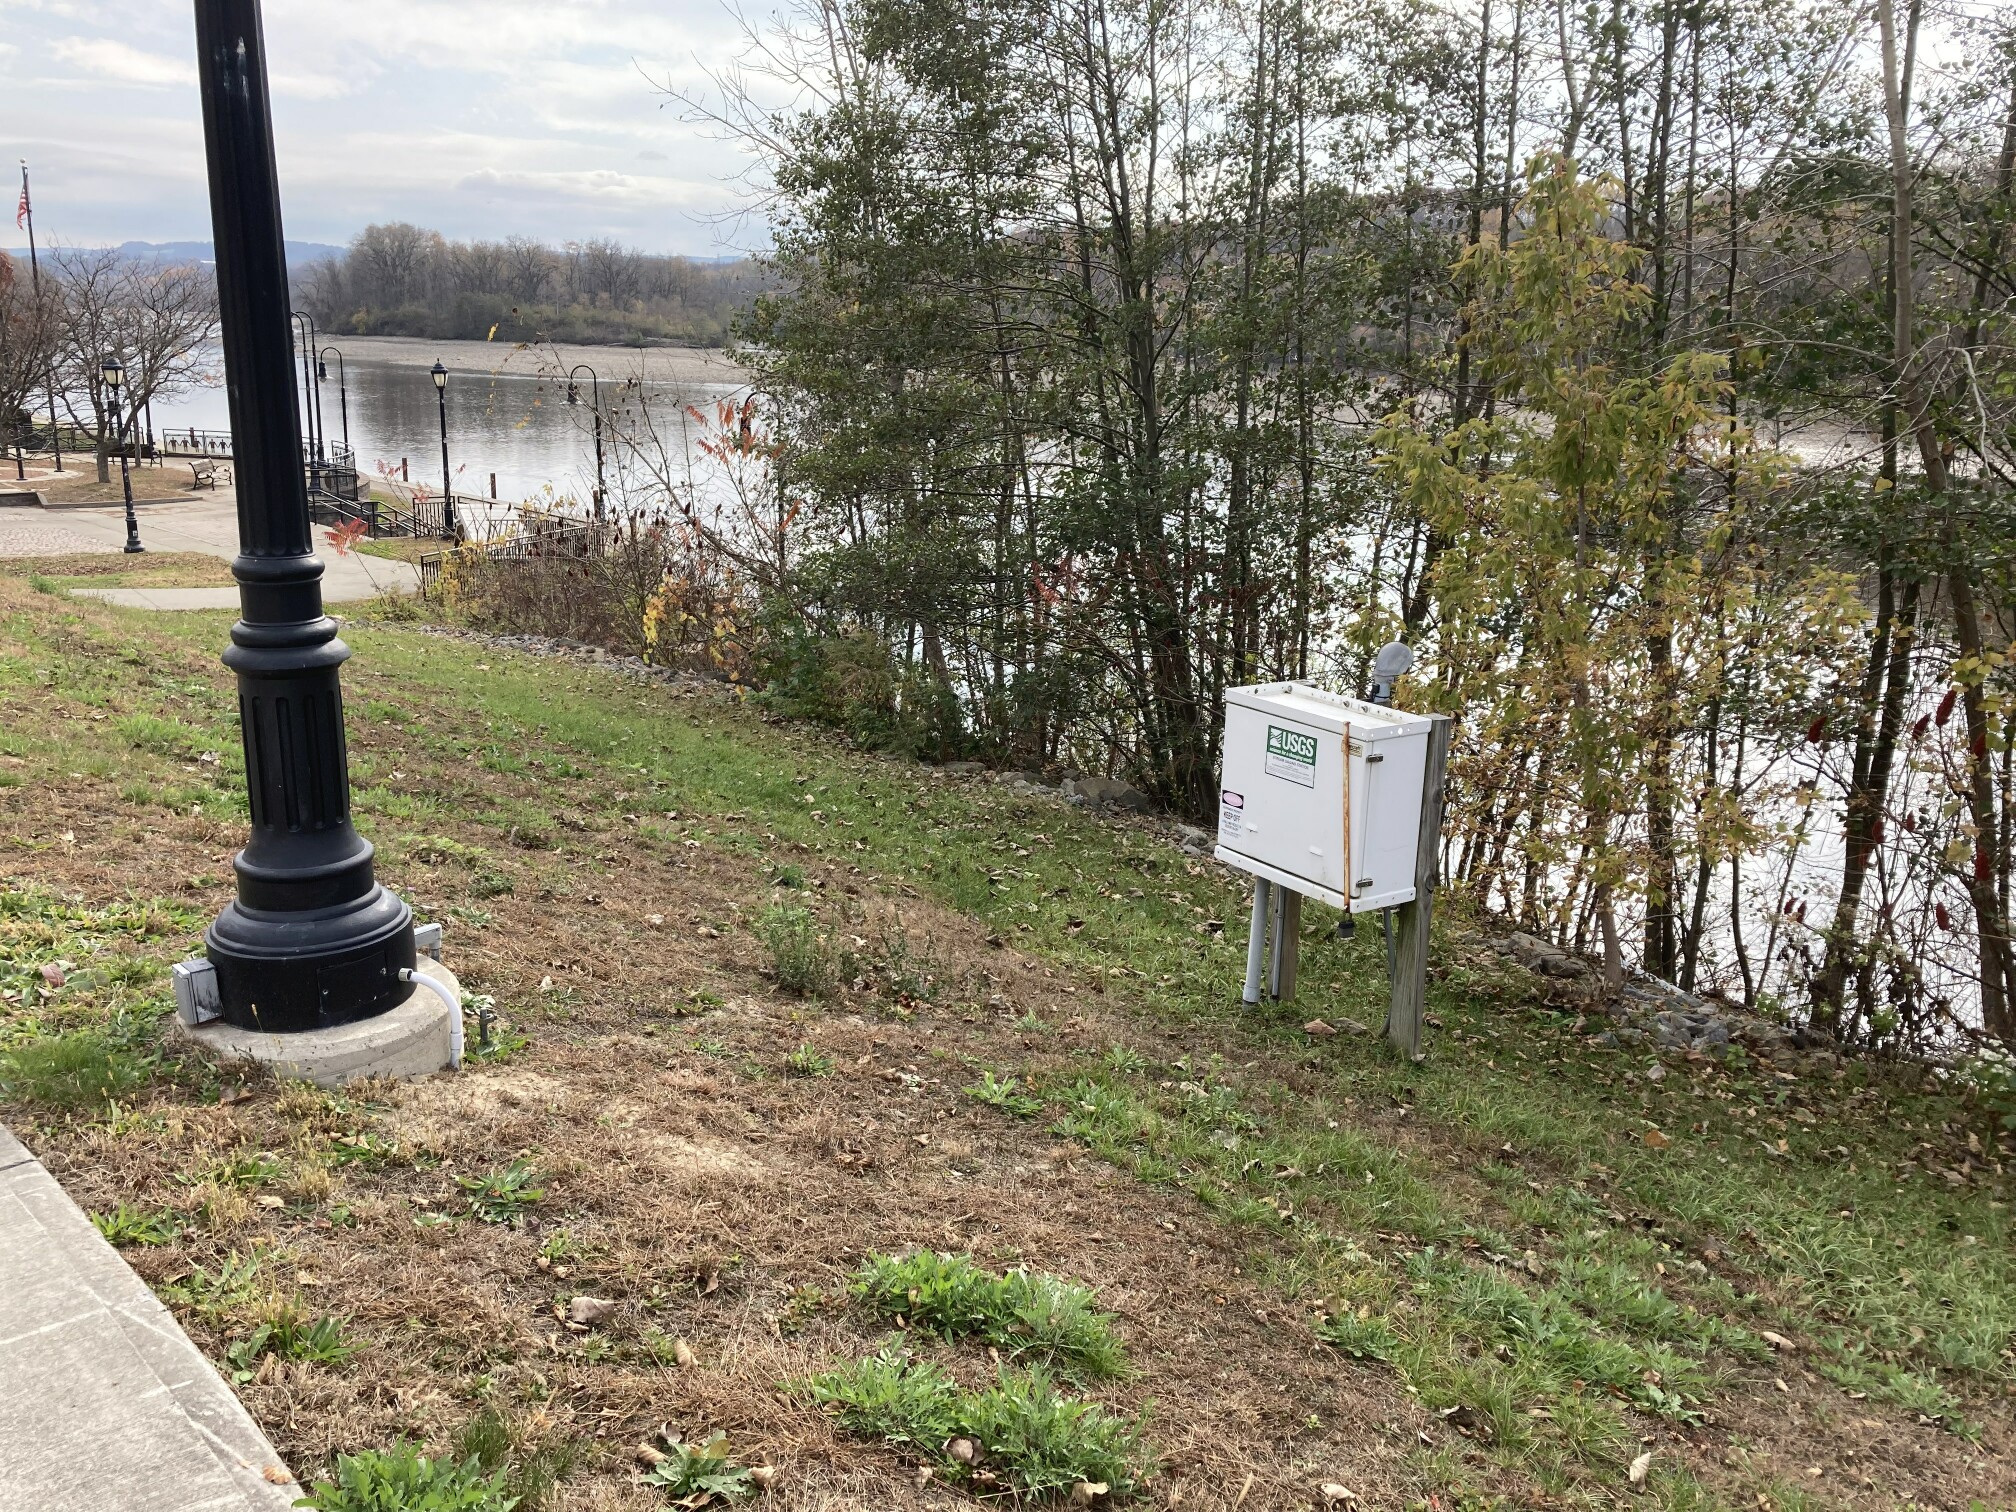 Station image
![Graph of Discharge, cubic feet per second, [Combined, final]](https://natwebcaww01.wr.usgs.gov/nwisweb/data/img/USGS.01354083.210239.00060..20260717.20260724.log.0.p50.gif)
