Explore the NEWUSGS National Water Dashboard interactive map to access real-time water data from over 13,500 stations nationwide.
This page is undergoing modernization with expected decommissioning as key features
are added to the modernized pages.
Learn more about our
modernization plans to find out which options will suit you best. Next Generation Monitoring Location Page
is available now.
A beta version of the My Favorites page is available in WDFN.
Try it out and tell us what you think at wdfn@usgs.gov
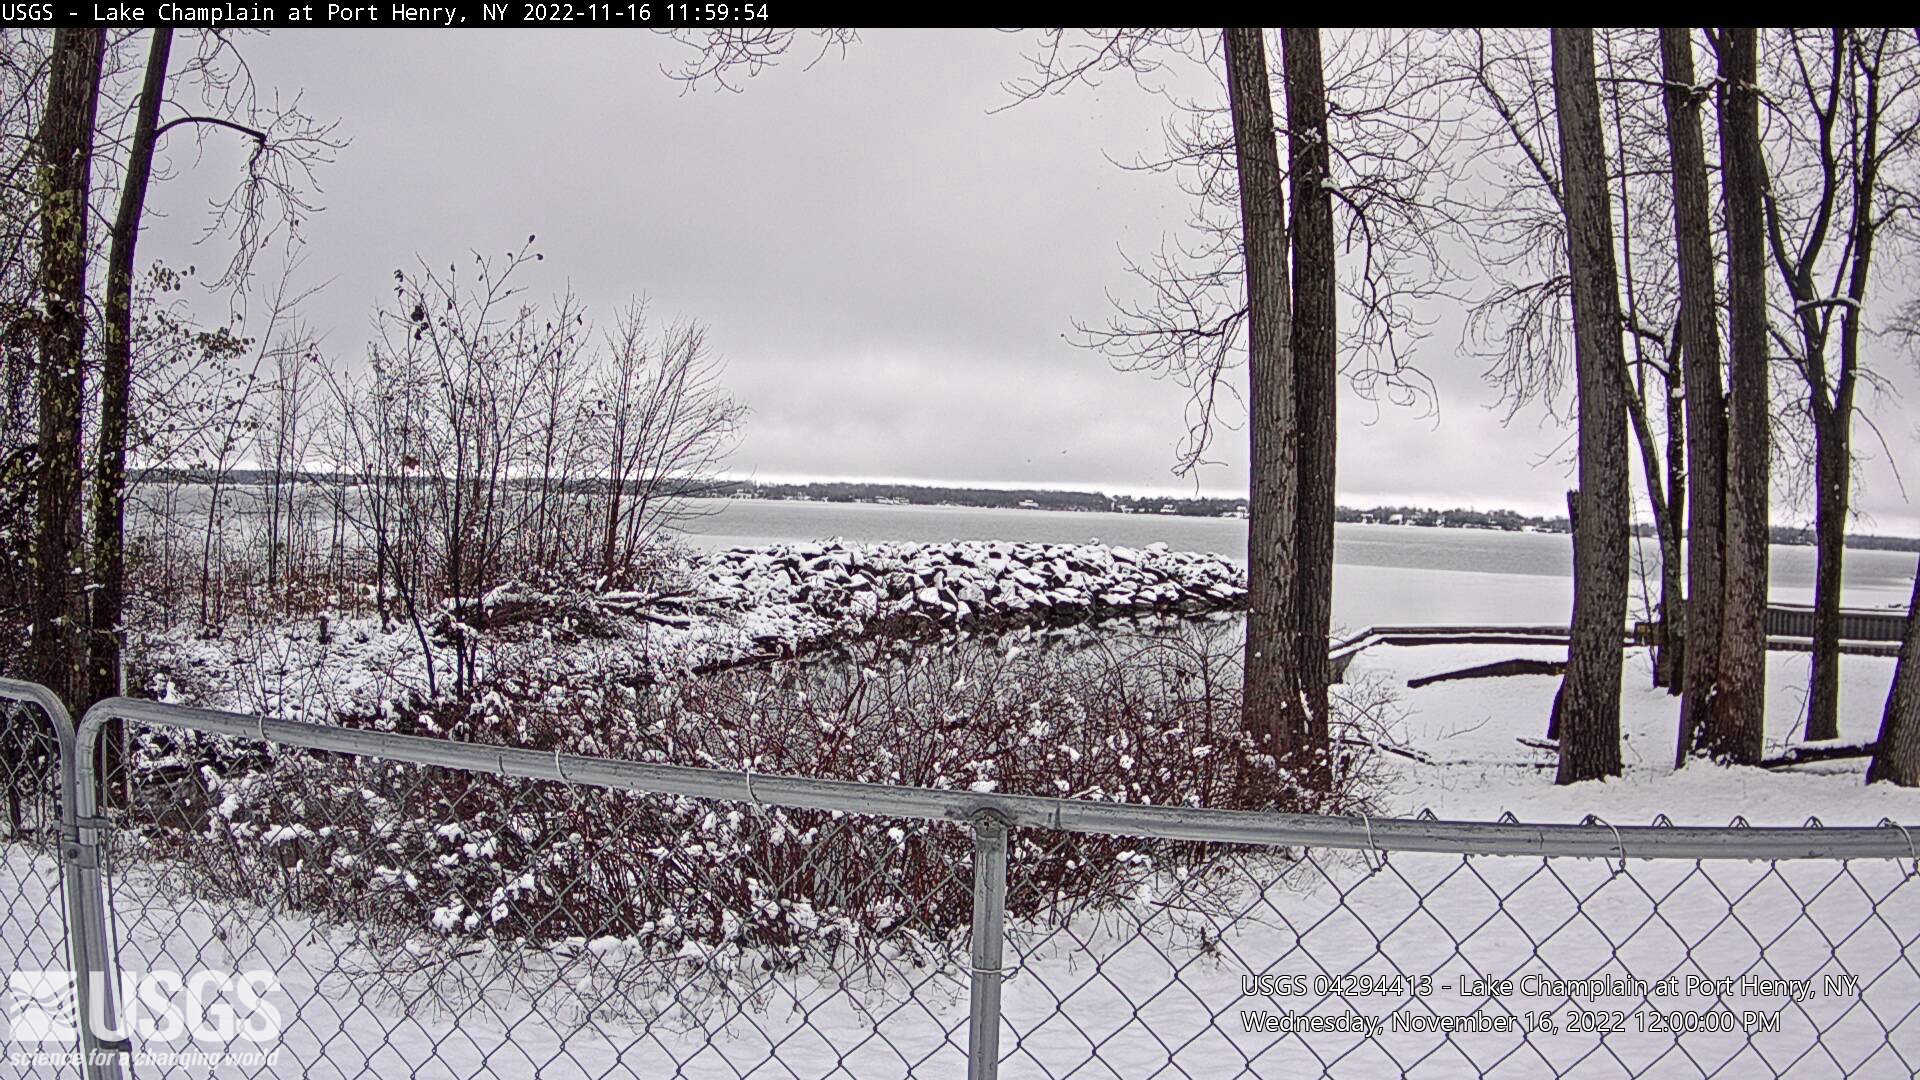
LOCATION.--Lat 44°03'09.9", long 73°27'12.6" referenced to North American Datum of 1983, Essex County, NY, Hydrologic Unit 04150408, on west shore at boat launch near mouth of Mill Brook and 0.5 mi north of railroad station, in Port Henry. PERIOD OF RECORD.--October 1997 to September 1999, April 2015 to current year. REVISIONS HISTORY.--Temperature data for the period Aug. 5, 2021, to Aug. 17, 2021, were revised on Feb. 28, 2023, due to incorrect data being deleted. Temperature records for the period Oct. 26, 2017 to Jan. 12, 2021 were revised on Mar. 24, 2023, after data were found outside the allowable limits. GAGE.--Water-stage recorder and digital weighing precipitation gage. Lake elevation record is provided in NGVD of 1929 and NAVD of 1988 datums. To convert NGVD of 1929 elevations to NAVD of 1988, subtract 0.60 ft. REMARKS.--Area of lake surface about 490 mi². Total volume below 92.5 ft elevation, reported by Lake Champlain Studies Center, 902.2 bil ft³. EXTREMES FOR PERIOD OF RECORD.--Maximum elevation, 101.90 ft above NGVD of 1929 (101.30 ft above NAVD of 1988), Apr. 4, 5, 1998; minimum, 93.23 ft above NGVD of 1929 (92.63 ft above NAVD of 1988), Oct. 16, 2016. EXTREMES OUTSIDE PERIOD OF RECORD.--Flood in May 2011 reached an elevation of about 103.1 ft above NGVD of 1929 (102.5 ft above NAVD of 1988), from floodmarks at mouth of Mill Brook 580 ft southeast from gage; corroborated by lake elevation record at station 04295000. PERIOD OF RECORD (CLIM).--April 2015 to current year. INSTRUMENTATION (CLIM).--Unshielded, 400 square centimeter collecting area, digital weighing precipitation gage, mounted on pedestal with top of collector 5 ft above ground. EXTREMES FOR PERIOD OF RECORD (CLIM).--Maximum daily precipitation, 5.36 inches, Oct. 31, 2019. PERIOD OF DAILY RECORD1.--WATER TEMPERATURE: October 1997 to September 1999, October 2017 to current year. EXTREMES FOR PERIOD OF DAILY RECORD1.--WATER TEMPERATURE: Maximum, 27.6°C, Sept. 5, 2023; minimum, 0.0°C on several days during winter periods. 1 Water-Quality Records