LOCATION.--Lat 41°15'32", long 95°55'20"
referenced to North American Datum of 1927, in SE 1/4 NW 1/4 sec.23,
T.15 N., R.13 E., Douglas County, NE, Hydrologic Unit 10230006, on
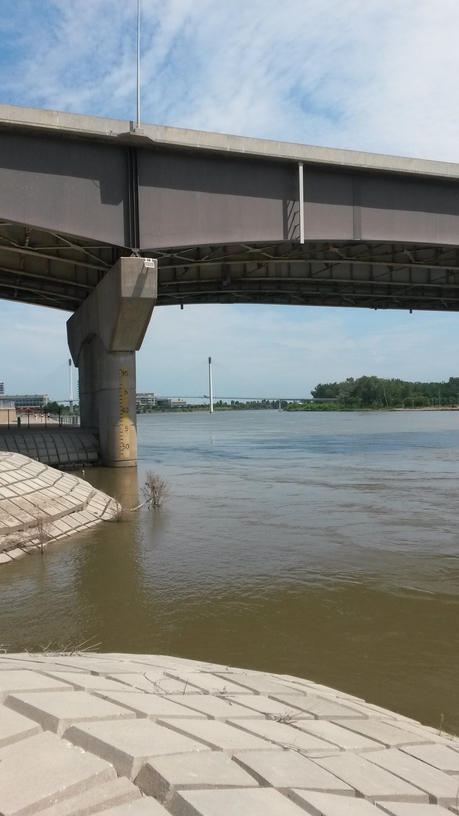
right bank on right side of concrete floodwall at foot of Douglas
Street, 275 ft downstream from bridge on U.S. Interstate 480 in
Omaha, and 615.9 mi upstream from mouth. Water-quality samples
collected by boat, 8.5 mi downstream from gage. (map)
DRAINAGE AREA.--322,800 mi2.
SURFACE-WATER RECORDS
PERIOD OF RECORD.--Discharge records from September 1928 to
current year. Stage-only records from April 1872 to December 1899 in
reports of the Missouri River Commission, and since January 1875 in
reports of the U.S. National Weather Service.
REVISED RECORDS.--WSP 761: Drainage area.
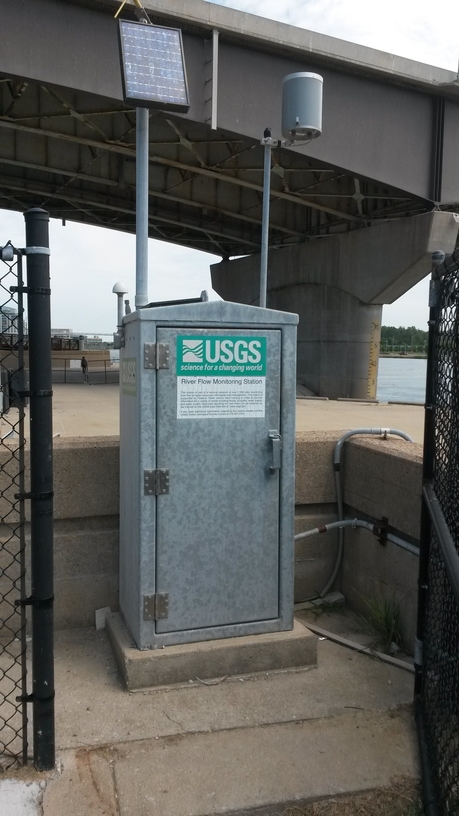
GAGE.--Water-stage recorder. Datum of gage is
948.97 ft above North American Vertical Datum of 1988. Prior to
August 1, 2016, datum of gage was 948.24 ft above National Geodetic
Vertical Datum of 1929. April 10, 1872, to February 28, 1907,
non-recording gage at several sites within 0.6 mi of current site at
datum 9.57 ft higher than current datum; March 1, 1907 to August 31,
1928, non-recording gage at Douglas Street bridge 10.00 ft higher
than current datum. September 1, 1928, to November 30, 1929,
non-recording gage attached to Illinois Central Railroad bridge at
site 2.0 mi upstream at datum 12.97 ft higher; December 1, 1929, to
October 18, 1931, non-recording gage at Douglas Street bridge at
datum 10.00 ft higher; October 19, 1931, to September 30, 1936,
water-stage recorder at site 0.4 mi downstream at datum 10.00 ft
higher; October 1, 1936, to September 30, 1982, at Douglas Street
bridge at datum 10.00 ft higher; October 1, 1982, to September 26,
2005, at Douglas Street bridge at same datum as current datum;
September 27, 2005, to July 31, 2016, at site 150 ft upstream of
Douglas Street bridge and same datum.
REMARKS.--Flow regulated by upstream main-stem reservoirs. Fort
Randall Dam was completed in July 1952, with storage beginning in
December 1952. Gavins Point Dam was completed in July 1955, with
storage beginning in December 1955.
WATER-QUALITY RECORDS
PERIOD OF RECORD.--Water years 1969-1976, 1978 to current
year.
PERIOD OF DAILY RECORD.--
SPECIFIC CONDUCTANCE: Daily instantaneous values collected in
conjunction with suspended-sediment samples, October 1972 to
September 1976, January 1978 to September 1981, October 1991 to
September 2003, October 2008 to September 2010, records fragmentary
for some periods. Beginning in October 2010, daily instantaneous
values published in combined water-quality table.
WATER TEMPERATURE: Daily instantaneous values collected in
conjunction with suspended-sediment samples, October 1971 to
September 1976, January 1978 to September 1981, October 1991 to
September 2003, October 2008 to September 2010, records fragmentary
for some periods. Beginning in October 2010, daily instantaneous
values published in combined water-quality table. Daily mean, October
2011 to current year.
SUSPENDED-SEDIMENT CONCENTRATION AND DISCHARGE: April 1939 to
December 1959, April to November 1960, April to November 1961, March
to November 1962, March to October 1963, April to October 1964, April
to December 1965, February 1966 to January 1967, March to December
1967, April to December 1968, March 1969 to September 1971, October
1971 to September 1976, October 1991 to September 2003, October 2008
to current year. Prior to October 1971, suspended-sediment discharge
records only, provided by U.S. Army Corps of Engineers.
 Site Information