Warning: Javascript must be enabled to use all the features on this page!


Page Loading - Please Wait...

Click to hideNews Bulletins
  • Due to a lapse in government funding, the majority of USGS websites will not be updated except to provide important public safety information. Websites displaying real-time water data will be updated with limited support. For more information please see www.doi.gov/shutdown.
  • Explore the NEW USGS National Water Dashboard interactive map to access real-time water data from over 13,500 stations nationwide.
! This page is undergoing modernization with expected decommissioning as key features are added to the modernized pages.
Learn more about our modernization plans to find out which options will suit you best. Next Generation Monitoring Location Page is available now.
A beta version of the My Favorites page is available in WDFN. Try it out and tell us what you think at wdfn@usgs.gov

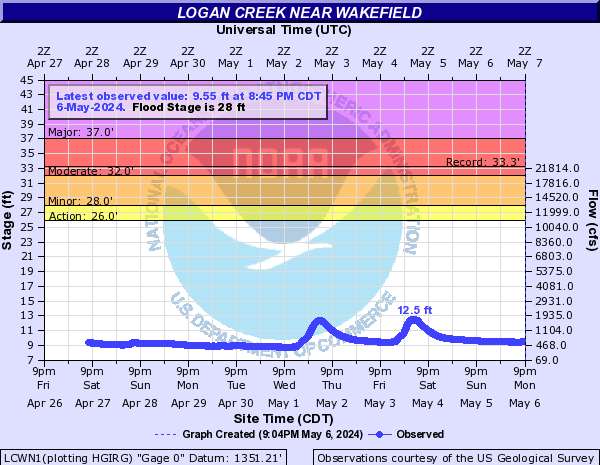
USGS 06799445 Logan Creek at Wakefield, Nebr.

PROVISIONAL DATA SUBJECT TO REVISION

Click to hidestation-specific text
Funding for this site is provided by
 logo
Winnebago Tribe
of Nebraska
Cooperative Water Program
> WaterNow – get the latest gage data from your mobile phone or email.
> Rating Information

View downstream from USGS gaging station: Logan Creek at Wakefield, Nebr.

Upstream Elkhorn River Basin Downstream

This station managed by the Lincoln Field Office.

Available Parameters Available Period
  
2002-10-01  2025-10-24
2007-10-01  2025-10-24


 (7)
 

  -- or --


Summary of all available data for this site
Instantaneous-data availability statement


Discharge, cubic feet per second

Most recent instantaneous value: 154 10-24-2025   01:45 CDT
Graph of  Discharge, cubic feet per second

Add up to 2 more sites and replot for "Discharge, cubic feet per second"

?


Create presentation-quality / stand-alone graph.   Subscribe to WaterAlert      

See this graph on the Monitoring Location Pages


Daily discharge, cubic feet per second -- statistics for Oct 24 based on 23 water years of record more
Min
(2023)
25th
percen-
tile
Median Most Recent
Instantaneous
Value Oct 24
Mean 75th
percen-
tile
Max
(2009)
50.6 80 104 154 168 265 489


Gage height, feet

Most recent instantaneous value: 7.19 10-24-2025   01:45 CDT
Graph of  Gage height, feet

Add up to 2 more sites and replot for "Gage height, feet"

?


Create presentation-quality / stand-alone graph.   Subscribe to WaterAlert      

See this graph on the Monitoring Location Pages