Warning: Javascript must be enabled to use all the features on this page!


Page Loading - Please Wait...

Click to hideNews Bulletins
! This page is undergoing modernization with expected decommissioning as key features are added to the modernized pages.
Learn more about our modernization plans to find out which options will suit you best. Next Generation Monitoring Location Page is available now.
A beta version of the My Favorites page is available in WDFN. Try it out and tell us what you think at wdfn@usgs.gov

USGS 50093045 LAGO PATILLAS AT DAMSITE NEAR PATILLAS, PR

PROVISIONAL DATA SUBJECT TO REVISION

Click to hidestation-specific text
Click to go to the Autoridad de Energia Electrica de Puerto Rico web page

Station Drainage Area


Gate opening, height Disclaimer

Gate opening, height monitoring sites operated by the USGS in Puerto Rico are strictly for operation al purposes. Gate opening, height data, if available, are temporary and will only be displayed for 120 days. Gate opening, height data will NOT be available for retrieval following the 120-day display period. The temporary classification means that documented routine inspections and other quality assurance measures are not performed that would make the data acceptable for archival, retrieval, or future use in general scientific or interpretive studies.


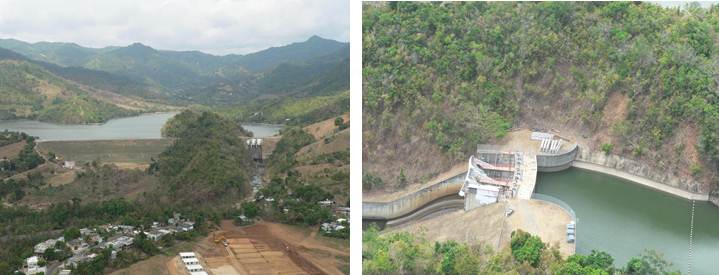
Image of Lago Patillas at Damsite near Patillas
Aerial photos courtesy of Puerto Rico Energy and Power Authority (PREPA).
This station managed by the Caribbean-Florida WSC - San Juan.

Available Parameters Available Period
  
2016-10-01  2025-01-04
2024-09-06  2025-01-04
2024-09-06  2025-01-04
2024-09-06  2025-01-04
2007-10-01  2025-01-04
2007-10-01  2025-01-04
2007-10-01  2025-01-04
2007-10-01  2025-01-04


 (7)
 

  -- or --


Summary of all available data for this site
Instantaneous-data availability statement


Precipitation, total, inches

Most recent instantaneous value: 0.00 01-04-2025   21:45 AST
Graph of  Precipitation, total, inches

Add up to 2 more sites and replot for "Precipitation, total, inches"

?


Create presentation-quality / stand-alone graph.   Subscribe to WaterAlert      

See this graph on the Monitoring Location Pages


Gate opening, height, feet, Gate 1

Most recent instantaneous value: -0.03 01-04-2025   21:45 AST
Graph of  Gate opening, height, feet

Add up to 2 more sites and replot for "Gate opening, height, feet, Gate 1"

?


Create presentation-quality / stand-alone graph.   Subscribe to WaterAlert      

See this graph on the Monitoring Location Pages


Gate opening, height, feet, Gate 2

Most recent instantaneous value: 0.10 01-04-2025   21:45 AST
Graph of  Gate opening, height, feet

Add up to 2 more sites and replot for "Gate opening, height, feet, Gate 2"

?


Create presentation-quality / stand-alone graph.   Subscribe to WaterAlert      

See this graph on the Monitoring Location Pages


Gate opening, height, feet, Gate 3

Most recent instantaneous value: -0.05 01-04-2025   21:45 AST
Graph of  Gate opening, height, feet

Add up to 2 more sites and replot for "Gate opening, height, feet, Gate 3"

?


Create presentation-quality / stand-alone graph.   Subscribe to WaterAlert      

See this graph on the Monitoring Location Pages


Lake or reservoir elevation above local mean sea level (LMSL), feet, [OLDPR]

Most recent instantaneous value: 212.29 01-04-2025   21:45 AST
Graph of  Lake or reservoir elevation above local mean sea level (LMSL), feet, [OLDPR]

Add up to 2 more sites and replot for "Lake or reservoir elevation above local mean sea level (LMSL), feet, [OLDPR]"

?


Create presentation-quality / stand-alone graph.   Subscribe to WaterAlert      

See this graph on the Monitoring Location Pages


Lake or reservoir elevation above local mean sea level (LMSL), meters, [OLDPR]

Most recent instantaneous value: 64.706 01-04-2025   21:45 AST
Graph of  Lake or reservoir elevation above local mean sea level (LMSL), meters, [OLDPR]

Add up to 2 more sites and replot for "Lake or reservoir elevation above local mean sea level (LMSL), meters, [OLDPR]"

?


Create presentation-quality / stand-alone graph.   Subscribe to WaterAlert      

See this graph on the Monitoring Location Pages


Lake or reservoir elevation, above Puerto Rico Datum of 2002, feet

Most recent instantaneous value: 211.85 01-04-2025   21:45 AST
Graph of  Lake or reservoir elevation, above Puerto Rico Datum of 2002, feet

Add up to 2 more sites and replot for "Lake or reservoir elevation, above Puerto Rico Datum of 2002, feet"

?


Create presentation-quality / stand-alone graph.   Subscribe to WaterAlert      

See this graph on the Monitoring Location Pages


Lake or reservoir elevation, above Puerto Rico Datum of 2002, meters

Most recent instantaneous value: 64.572 01-04-2025   21:45 AST
Graph of  Lake or reservoir elevation, above Puerto Rico Datum of 2002, meters

Add up to 2 more sites and replot for "Lake or reservoir elevation, above Puerto Rico Datum of 2002, meters"

?


Create presentation-quality / stand-alone graph.   Subscribe to WaterAlert      

See this graph on the Monitoring Location Pages