LOCATION.--Lat 42°28'21.5", long
74°26'28.1" referenced to North American Datum of
1983, Schoharie County, NY, Hydrologic Unit 02020005, on right
bank at bridge on State Highway 30, 0.8 mi downstream from West
Brook, and 2 mi northeast of North Blenheim.
DRAINAGE AREA.--405 mi².
PERIOD OF RECORD.--November 2017 to current year.
GAGE.--Water-stage recorder and crest-stage
gage. Datum of gage is 766.54 ft above NAVD of 1988.
REMARKS.--Regulation of flow by New York Power Authority
Blenheim-Gilboa Pumped Storage Project upstream from gage.
Entire flow, runoff from 315 mi², except for periods of spill,
diverted from Schoharie Reservoir through Shandaken Tunnel into
Esopus Creek upstream from Ashokan Reservoir for water supply
of City of New York. Water Years 2018-22: Records fair except
those for estimated discharges, which are poor.
EXTREMES FOR PERIOD OF RECORD.--Maximum discharge,
43,300 ft³/s, Dec. 25, 2020, gage height, 18.45 ft, from
rating curve extended above 20,000 ft³/s; minimum discharge,
8.76 ft³/s, Aug. 14, 15, 2022, gage height 1.54 ft.
EXTREMES OUTSIDE PERIOD OF RECORD.--Flood of Aug. 28-29,
2011, reached a stage of 26.97 ft, from floodmark. Flood
of Jan. 19-20, 1996, reached a stage of 22.72 ft, from
floodmark. Flood of Apr. 4-5, 1987, reached a stage of 21.19
ft, from floodmark.

 Site Information
 WaterAlert – get an
email or text (SMS) alert based on your chosen threshold.
WaterAlert – get an
email or text (SMS) alert based on your chosen threshold.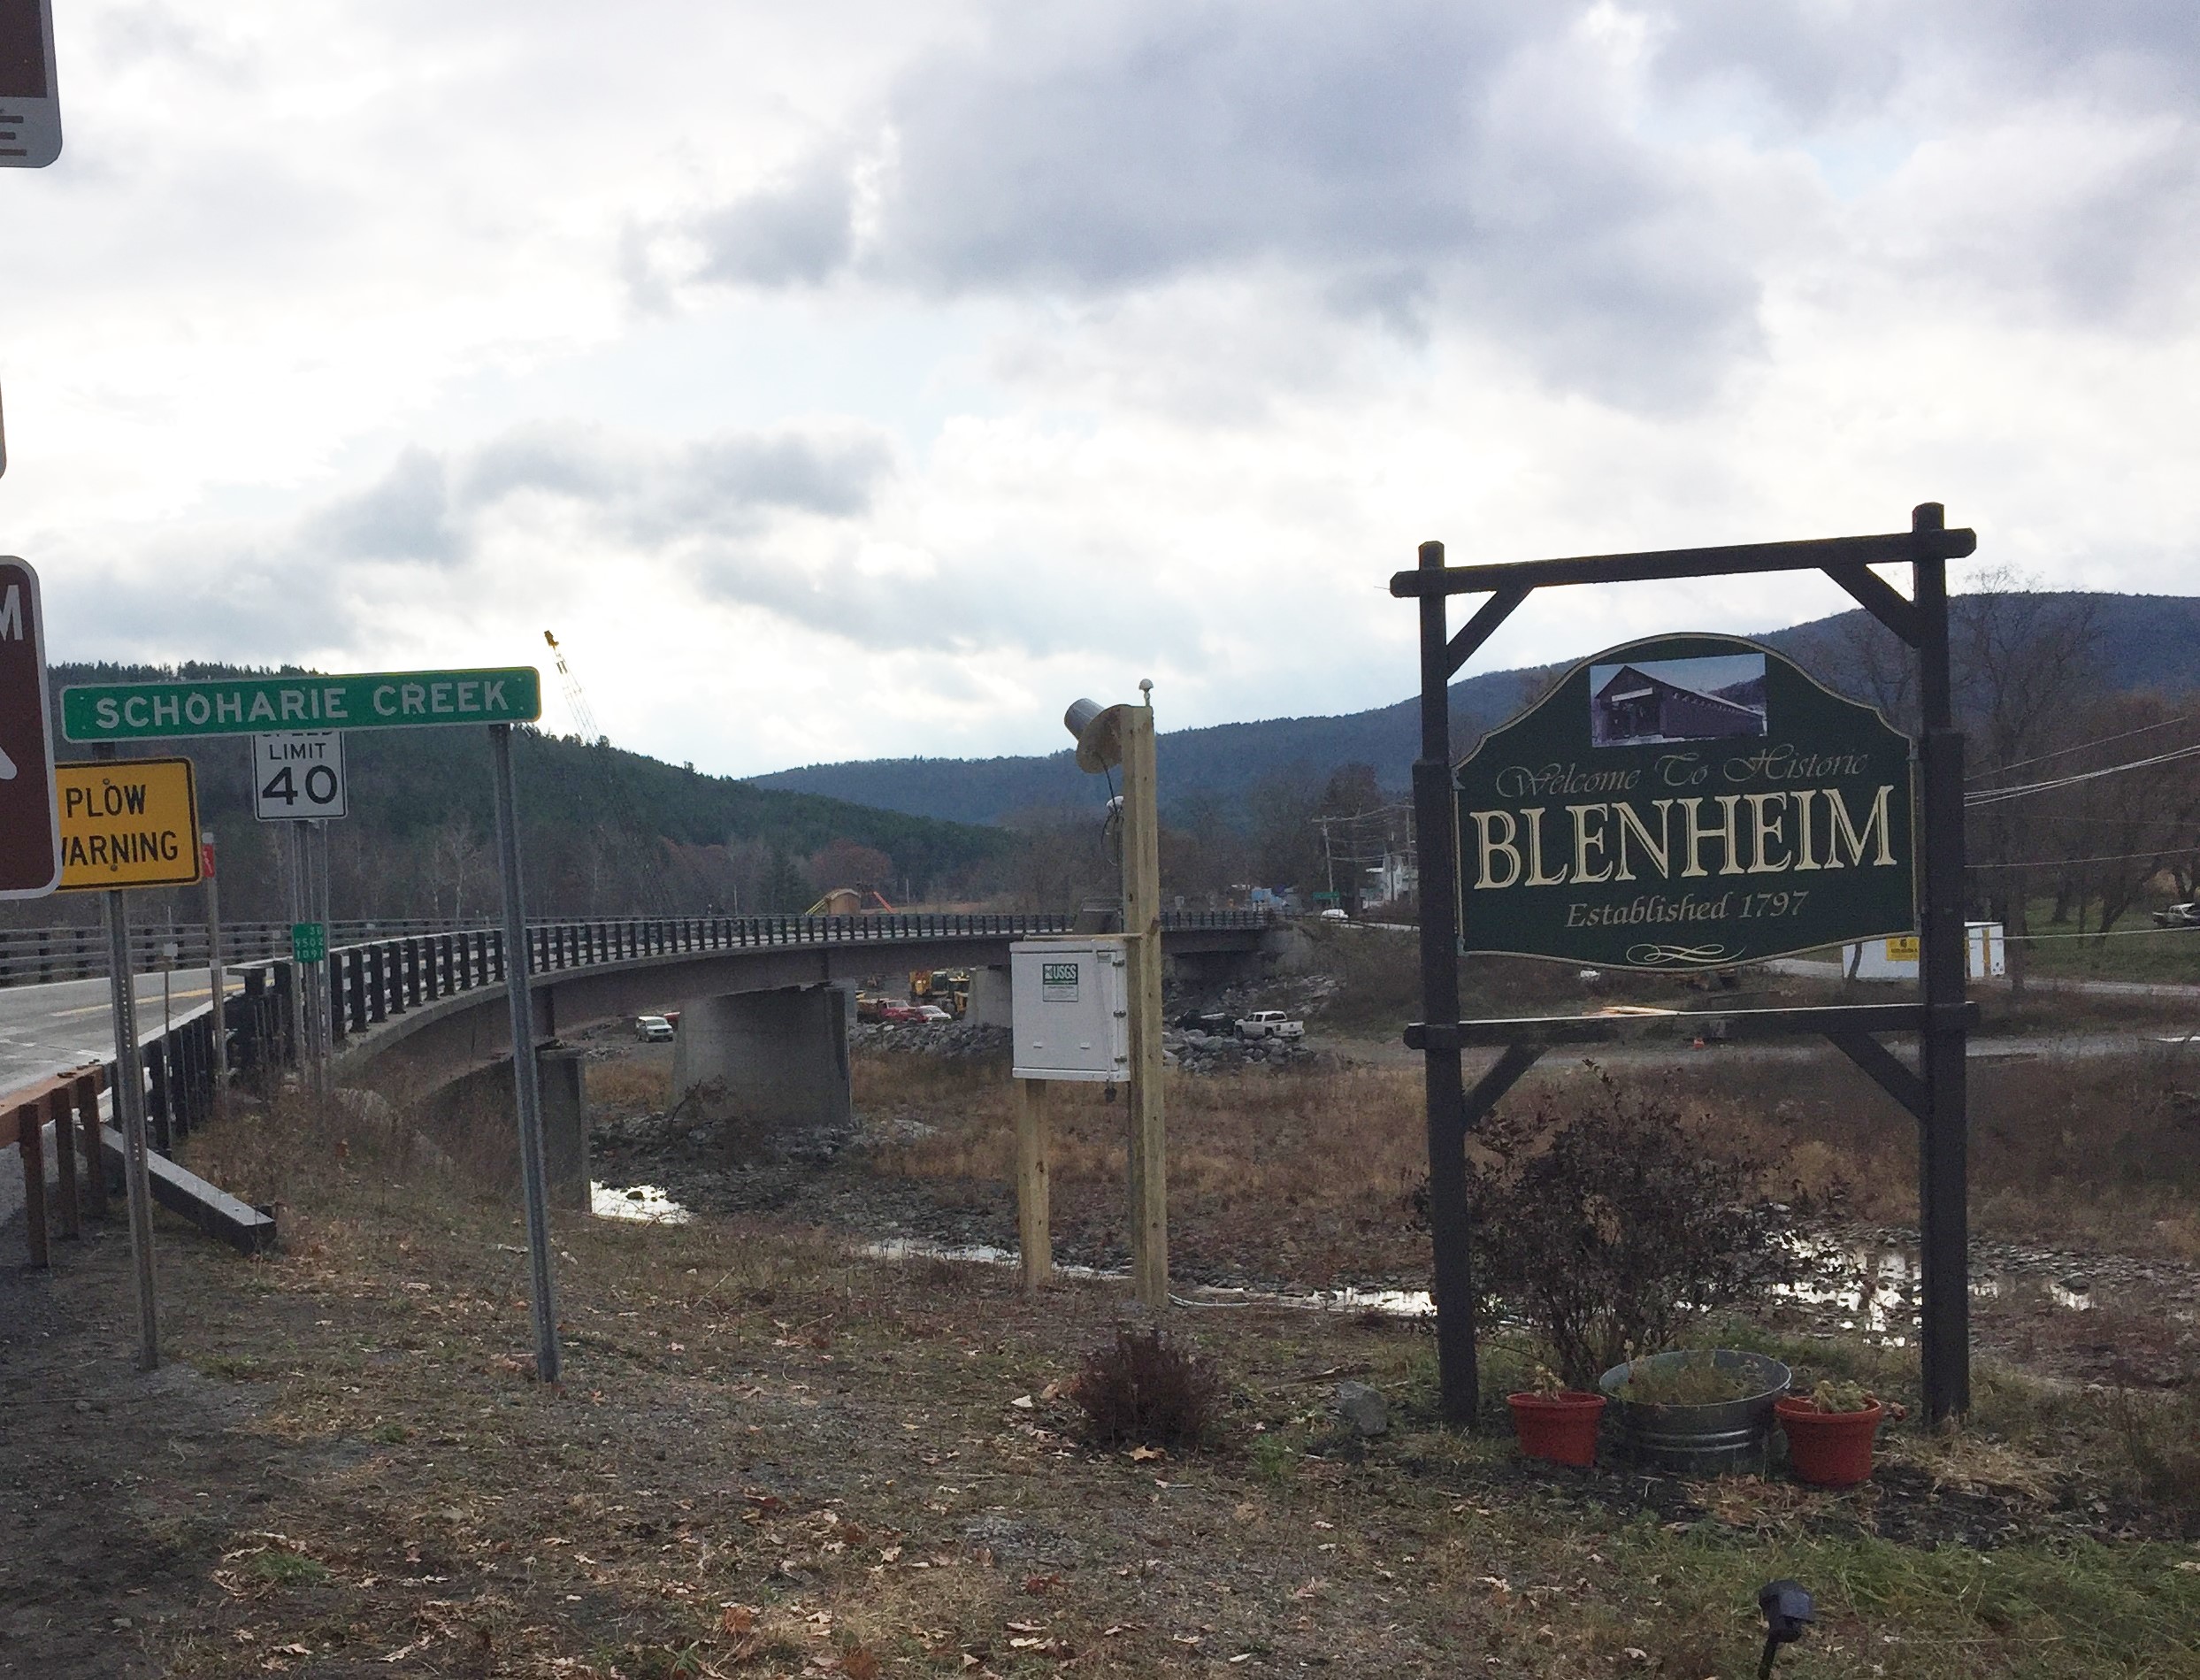 Station image
