LOCATION.--Lat 41°34'02.2", long
74°46'59.8" referenced to North American Datum of
1983, Sullivan County, NY, Hydrologic Unit 02040104, 1,500 ft
downstream of the dam on Swinging Bridge Reservoir.
DRAINAGE AREA.--116 mi².
PERIOD OF RECORD.--August 2019 to current year.
REVISIONS HISTORY.--Specific conductance records for the
period Nov. 10, 2020, to Jan. 12, 2023, were revised on Nov.
30, 2023, as the original data were not temperature compensated
to 25°C.
GAGE.--Water-stage recorder and crest-stage gage. Datum
of gage is 936.26 ft above NAVD of 1988.
REMARKS.--Entire flow regulated by powerplant and
storage in Swinging Bridge Reservoir (station 01433000). Total
flow includes a diversion from Cliff Lake (station 01433200)
discharged through a tunnel into Swinging Bridge Reservoir
(station 01433000).
Water Year 2019: Records fair. Water Years 2020-23: Records
fair except those for estimated daily discharges, which are
poor.
EXTREMES FOR PERIOD OF RECORD.--Maximum discharge, 1,410
ft³/s, Sept. 2, 2021, gage height, 6.56 ft; minimum daily
discharge, 0.16 ft³/s, Dec. 21, 2019; minimum instantaneous
discharge not determined.
PERIOD OF DAILY RECORD1.--WATER TEMPERATURE:
August 2019 to current year. DISSOLVED OXYGEN: August 2019 to
current year. SPECIFIC CONDUCTANCE: August 2019 to current
year.
INSTRUMENTATION1.--A continuous water-quality
monitor with water temperature, and dissolved oxygen provides
15-minute-interval readings.
REMARKS1.--Water temperature is affected by
release of water from upstream reservoir.
EXTREMES FOR PERIOD OF DAILY RECORD1.--WATER
TEMPERATURE: Maximum, 22.4 °C, Aug. 4, 2020, Sept. 1,
2021; minimum, 1.1 °C, Feb. 25, 2022. DISSOLVED OXYGEN:
Maximum, 13.9 mg/L, Jan. 31, 2023; minimum, 3.8 mg/L, Aug. 27,
2019. SPECIFIC CONDUCTANCE: Maximum, 349 uS/cm at 25 °C,
Mar. 26, 2021; minimum, 67 uS/cm at 25 °C, Sept. 1,
2021.
1 Water-Quality Records

 Site Information
 WaterAlert – get an
email or text (SMS) alert based on your chosen threshold.
WaterAlert – get an
email or text (SMS) alert based on your chosen threshold.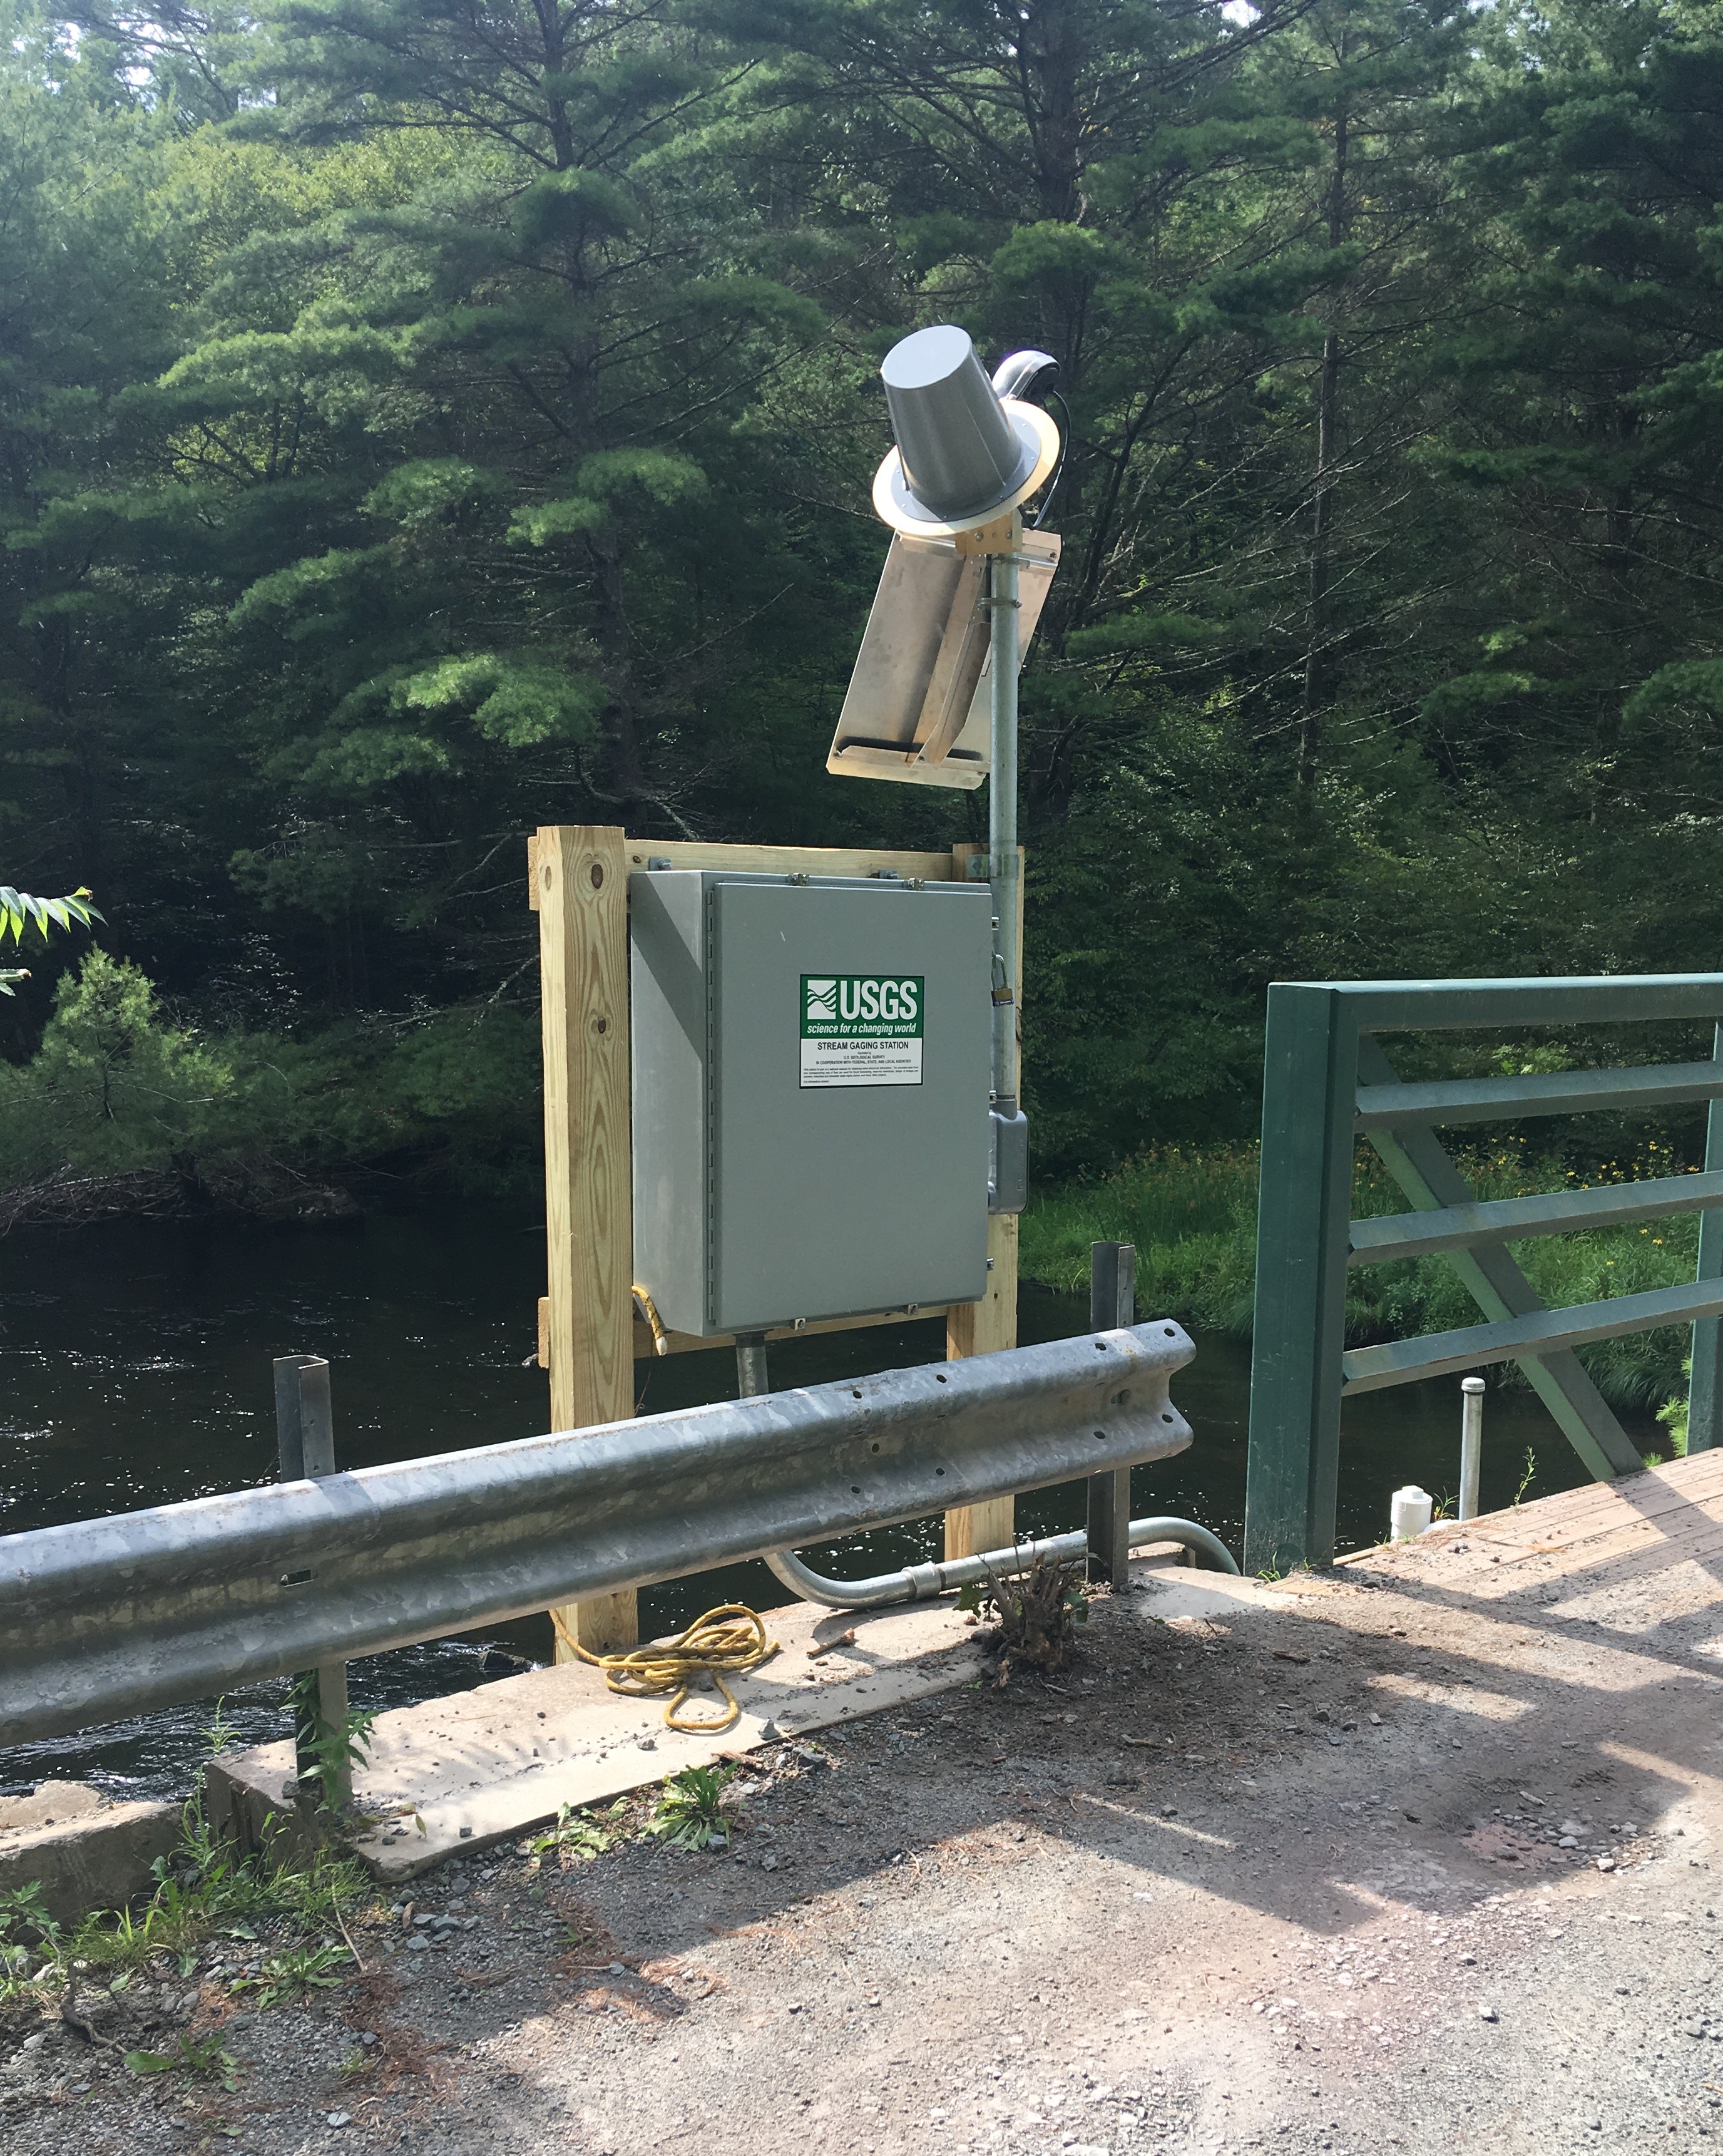 Station image


