Warning: Javascript must be enabled to use all the features on this page!


Page Loading - Please Wait...

* We've detected you're using a mobile device. Find our Next Generation Station Page here.
Click to hideNews Bulletins
! This page is undergoing modernization with expected decommissioning as key features are added to the modernized pages.
Learn more about our modernization plans to find out which options will suit you best. Next Generation Monitoring Location Page is available now.

USGS 01451630 Cedar Creek at Mouth near Allentown, PA

PROVISIONAL DATA SUBJECT TO REVISION

Click to hidestation-specific text
Funding for this site is provided by:


Station gage image
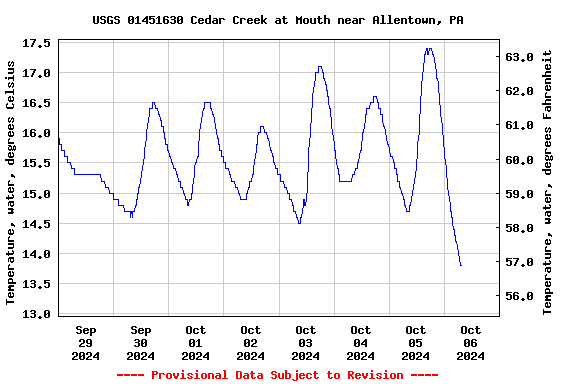
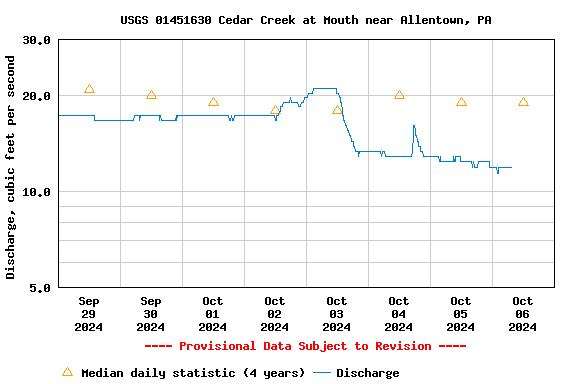
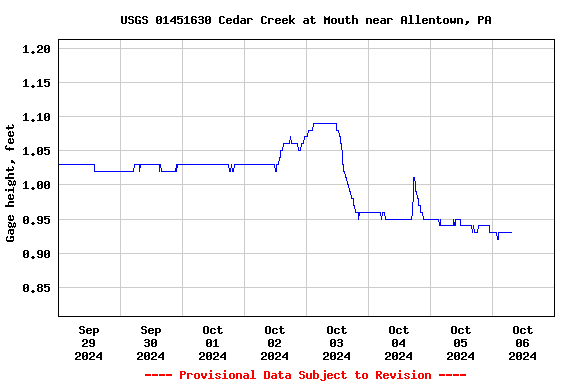
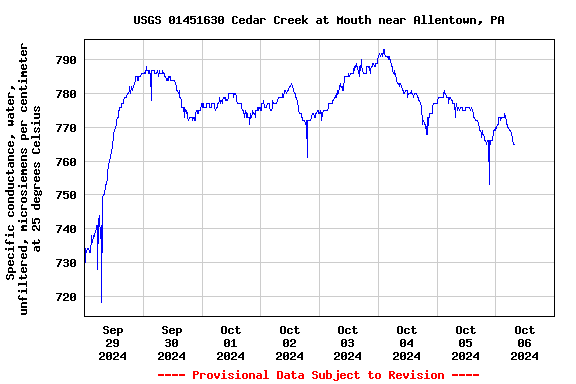
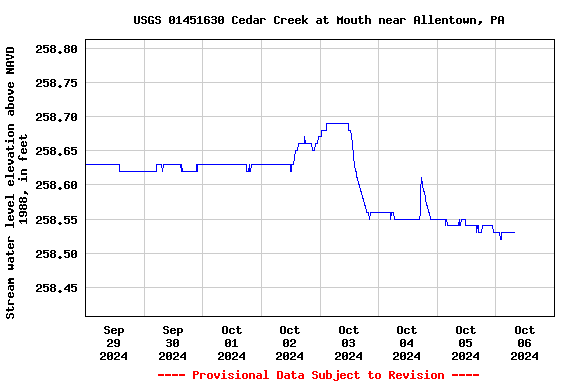
STATION.--01451630 CEDAR CREEK AT MOUTH NEAR ALLENTOWN, PA
LOCATION.--Lat 40`35'15", long 75`29'48", Lehigh County, Hydrologic Unit 02040106, on right bank, 200 ft upstream of Martin Luther King Jr Drive, 2000 ft upstream of confluence with Little Lehigh Creek.
DRAINAGE AREA.--14.5 square miles.
PERIOD OF RECORD.--January 2020 to current year.
GAGE.--Water-stage recorder, crest-stage gage, and water-quality monitor. Datum of gage is 257.6 ft above North American Vertical Datum of 1988. Satellite telemetry at station. Prior to November 7, 2022, the datum of gage was erroneously reported as 258 ft above NAVD88.
COOPERATION.--Station established and maintained by the U.S. Geological Survey. Funding for the operation of this station is provided by the U.S. Geological Survey.
GAGE HEIGHTS OF IMPORTANCE.-
Supplied by USGS: Maximum recordable gage height (stage sensor operational limit): 10.10 ft; Minimum recordable gage height (orifice): 0.37 ft.
This station managed by the PAWSC Downingtown Field Office.

Available Parameters Available Period
  
2020-01-16  2024-05-04
2020-01-16  2024-05-04
2020-01-16  2024-05-04
2020-01-16  2024-05-04
2021-10-01  2024-05-04


 (7)
 

  -- or --


Summary of all available data for this site
Instantaneous-data availability statement


Temperature, water, degrees Celsius

Most recent instantaneous value: 13.7 05-04-2024   14:30 EDT
Graph of

Add up to 2 more sites and replot for "Temperature, water, degrees Celsius"

?


Create presentation-quality / stand-alone graph.   Subscribe to WaterAlert      

See this graph on the Monitoring Location Pages


Discharge, cubic feet per second

Most recent instantaneous value: 28.9 05-04-2024   14:30 EDT
Graph of

Add up to 2 more sites and replot for "Discharge, cubic feet per second"

?


Create presentation-quality / stand-alone graph.   Subscribe to WaterAlert      

See this graph on the Monitoring Location Pages


Daily discharge, cubic feet per second -- statistics for May 4 based on 4 water years of record more
Min
(2023)
25th
percen-
tile
Mean Median 75th
percen-
tile
Max
(2021)
Most Recent
Instantaneous
Value May 4
22.1 23 24 24 25 24.7 28.9


Gage height, feet

Most recent instantaneous value: 1.17 05-04-2024   14:30 EDT
Graph of

Add up to 2 more sites and replot for "Gage height, feet"

?


Create presentation-quality / stand-alone graph.   Subscribe to WaterAlert      

See this graph on the Monitoring Location Pages


Specific conductance, water, unfiltered, microsiemens per centimeter at 25 degrees Celsius

Most recent instantaneous value: 810 05-04-2024   14:30 EDT
Graph of

Add up to 2 more sites and replot for "Specific conductance, water, unfiltered, microsiemens per centimeter at 25 degrees Celsius"

?


Create presentation-quality / stand-alone graph.   Subscribe to WaterAlert      

See this graph on the Monitoring Location Pages


Stream water level elevation above NAVD 1988, in feet

Most recent instantaneous value: 258.77 05-04-2024   14:30 EDT
Graph of

Add up to 2 more sites and replot for "Stream water level elevation above NAVD 1988, in feet"

?


Create presentation-quality / stand-alone graph.   Subscribe to WaterAlert      

See this graph on the Monitoring Location Pages