Warning: Javascript must be enabled to use all the features on this page!


Page Loading - Please Wait...

Click to hideNews Bulletins
! This page is undergoing modernization with expected decommissioning as key features are added to the modernized pages.
Learn more about our modernization plans to find out which options will suit you best. Next Generation Monitoring Location Page is available now.

USGS 01480685 Marsh Creek near Downingtown, PA

PROVISIONAL DATA SUBJECT TO REVISION

Click to hidestation-specific text


Station gage imageSTATION.--
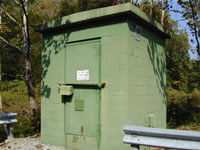
01480685 MARSH CREEK NEAR DOWNINGTOWN, PA
LOCATION.--Lat 40`03'19", long 75`43'00", Chester County, Hydrologic Unit 02040205, on left bank 1,000 ft downstream from Marsh Creek Dam, 0.2 mi upstream from mouth, and 3.0 mi north of Downingtown.
DRAINAGE AREA.--20.3 square miles.
PERIOD OF RECORD.--June 1973 to current year.
GAGE.--Water-stage recorder, crest-stage gage, and concrete control. Elevation of gage is 280 ft above National GeodeticVertical Datum of 1929, from topographic map.
REMARKS.--Flow completely regulated since November 1973 by Marsh Creek Reservoir.
COOPERATION.--Funding for the operation of this station is provided by the Pennsylvania Department of Environmental Protection and the U.S. Geological Survey.
GAGE HEIGHTS OF IMPORTANCE.-
Supplied by USGS: Data Transmitter Operational Limit - 10.1 ft
This station managed by the PAWSC Downingtown Field Office.

Available Parameters Available Period
  
1990-10-01  2024-04-26
2007-10-01  2024-04-26


 (7)
 

  -- or --


Summary of all available data for this site
Instantaneous-data availability statement


Discharge, cubic feet per second

Most recent instantaneous value: 5.19 04-26-2024   10:00 EDT
Graph of  Discharge, cubic feet per second

Add up to 2 more sites and replot for "Discharge, cubic feet per second"

?


Create presentation-quality / stand-alone graph.   Subscribe to WaterAlert      

See this graph on the Monitoring Location Pages


Daily discharge, cubic feet per second -- statistics for Apr 26 based on 49 water years of record more
Min
(1974)
Most Recent
Instantaneous
Value Apr 26
25th
percen-
tile
Median Mean 75th
percen-
tile
Max
(1983)
0.62 5.19 16 26 34 40 200


Gage height, feet

Most recent instantaneous value: 1.44 04-26-2024   10:00 EDT
Graph of  Gage height, feet

Add up to 2 more sites and replot for "Gage height, feet"

?


Create presentation-quality / stand-alone graph.   Subscribe to WaterAlert      

See this graph on the Monitoring Location Pages