Warning: Javascript must be enabled to use all the features on this page!


Page Loading - Please Wait...

Click to hideNews Bulletins
! This page is undergoing modernization with expected decommissioning as key features are added to the modernized pages.
Learn more about our modernization plans to find out which options will suit you best. Next Generation Monitoring Location Page is available now.

USGS 01545600 Young Womans Creek near Renovo, PA

PROVISIONAL DATA SUBJECT TO REVISION

Click to hidestation-specific text
Funding for this site is provided by:


Station gage imageSTATION.--01545600 YOUNG WOMANS CREEK NEAR RENOVO, PA (Hydrologic Benchmark Station)
LOCATION.--Lat 41`23'22", long 77`41'28", Clinton County, Hydrologic Unit 02050203, on left bank on SR 4005, 0.3 mi downstream from Laurelly Fork, 1.5 mi upstream from Left Branch Young Womans Creek, 3.7 mi upstream from mouth, and 5.0 mi northeast of Renovo.
DRAINAGE AREA.--46.2 square miles.
PERIOD OF RECORD.--December 1964 to current year.
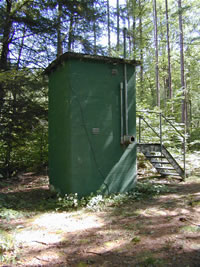
GAGE.--Water-stage recorder, water-quality monitor, and concrete control. Elevation of gage is 780.41 ft above National Geodetic Vertical Datum of 1929. Satellite telemetry at station.
COOPERATION.--Funding for the operation of this station is provided by the U.S. Geological Survey.
GAGE HEIGHTS OF IMPORTANCE.-
Supplied by USGS: Maximum recordable gage height (stage sensor operational limit) - 14.3 ft; Data transmitter operational limit - 15.7 ft;
Supplied by NWS: No flood stage has been determined for this station.
This station managed by the PAWSC Williamsport Field Office.

Available Parameters Available Period
  
2012-02-16  2024-05-10
1990-10-01  2024-05-10
2007-10-01  2024-05-10


 (7)
 

  -- or --


Summary of all available data for this site
Instantaneous-data availability statement


Temperature, water, degrees Celsius

Most recent instantaneous value: 11.2 05-10-2024   21:00 EDT
Graph of  Temperature, water, degrees Celsius

Add up to 2 more sites and replot for "Temperature, water, degrees Celsius"

?


Create presentation-quality / stand-alone graph.   Subscribe to WaterAlert      

See this graph on the Monitoring Location Pages


Discharge, cubic feet per second

Most recent instantaneous value: 86.2 05-10-2024   22:00 EDT
Graph of  Discharge, cubic feet per second

Add up to 2 more sites and replot for "Discharge, cubic feet per second"

?


Create presentation-quality / stand-alone graph.   Subscribe to WaterAlert      

See this graph on the Monitoring Location Pages


Daily discharge, cubic feet per second -- statistics for May 10 based on 59 water years of record more
Min
(1985)
25th
percen-
tile
Median Most Recent
Instantaneous
Value May 10
Mean 75th
percen-
tile
Max
(2021)
28.0 45 76 86.2 103 125 331


Gage height, feet

Most recent instantaneous value: 2.19 05-10-2024   22:00 EDT
Graph of

Add up to 2 more sites and replot for "Gage height, feet"

?


Create presentation-quality / stand-alone graph.   Subscribe to WaterAlert      

See this graph on the Monitoring Location Pages