Warning: Javascript must be enabled to use all the features on this page!


Page Loading - Please Wait...

Click to hideNews Bulletins
! This page is undergoing modernization with expected decommissioning as key features are added to the modernized pages.
Learn more about our modernization plans to find out which options will suit you best. Next Generation Monitoring Location Page is available now.

USGS 01545800 WB Susquehanna River at Lock Haven, PA

PROVISIONAL DATA SUBJECT TO REVISION

Click to hidestation-specific text


Station gage imageSTATION.--
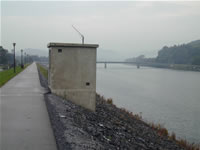
01545800 WEST BRANCH SUSQUEHANNA RIVER AT LOCK HAVEN, PA
LOCATION.--Lat 41`08'17", long 77`26'32", Clinton County, Hydrologic Unit 02050203, on right bank 1250 ft downstream from Jay Street bridge, and 2.1 mi upstream from Bald Eagle Creek.
DRAINAGE AREA.--3,345 square miles.
PERIOD OF RECORD.--1975 to current year.
GAGE.--Water-stage recorder and concrete control. Datum of gage is 534.52 ft above North American Vertical Datum of 1988. Satellite telemetry at station.
COOPERATION.--Funding for the operation of this station is provided by the Pennsylvania Department of Environmental Protection and the U.S. Geological Survey.
REMARKS.--Daily discharge not available from 1975 through September 2017.
GAGE HEIGHTS OF IMPORTANCE.-
Supplied by USGS: Maximum recordable gage height (stage sensor operational limit) - 40.9 ft; Data transmitter operational limit - 42.3 ft; 39 feet at top of levee.
Supplied by NWS: Action stage-17 ft, monitor for rising waters; homes downstream along Antes Creek affected; Flood stage-21 ft, the right or south bank overflows in areas not protected by levee system; Moderate flood stage-23 ft, considerable flooding if levee not in place; Major flood stage-25 ft, numerous homes and businesses would be flooded if levee not in place.
This station managed by the PAWSC Williamsport Field Office.

Available Parameters Available Period
  
2017-10-01  2024-04-26
2017-10-01  2024-04-26
2021-10-01  2024-04-26


 (7)
 

  -- or --


Summary of all available data for this site
Instantaneous-data availability statement


Discharge, cubic feet per second

Most recent instantaneous value: 8820 04-26-2024   10:15 EDT
Graph of  Discharge, cubic feet per second

Add up to 2 more sites and replot for "Discharge, cubic feet per second"

?


Create presentation-quality / stand-alone graph.   Subscribe to WaterAlert      

See this graph on the Monitoring Location Pages


Gage height, feet

Most recent instantaneous value: 9.79 04-26-2024   10:15 EDT
Graph of  Gage height, feet

Add up to 2 more sites and replot for "Gage height, feet"

?


Create presentation-quality / stand-alone graph.   Subscribe to WaterAlert      

See this graph on the Monitoring Location Pages


Stream water level elevation above NAVD 1988, in feet

Most recent instantaneous value: 544.31 04-26-2024   10:15 EDT
Graph of  Stream water level elevation above NAVD 1988, in feet

Add up to 2 more sites and replot for "Stream water level elevation above NAVD 1988, in feet"

?


Create presentation-quality / stand-alone graph.   Subscribe to WaterAlert      

See this graph on the Monitoring Location Pages