Warning: Javascript must be enabled to use all the features on this page!


Page Loading - Please Wait...

Click to hideNews Bulletins
! This page is undergoing modernization with expected decommissioning as key features are added to the modernized pages.
Learn more about our modernization plans to find out which options will suit you best. Next Generation Monitoring Location Page is available now.

USGS 01566000 Tuscarora Creek near Port Royal, PA

PROVISIONAL DATA SUBJECT TO REVISION

Click to hidestation-specific text


Station gage imageSTATION.--
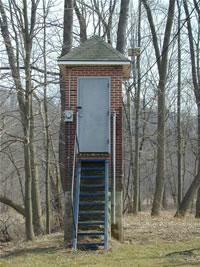
01566000 TUSCARORA CREEK NEAR PORT ROYAL, PA
LOCATION.--Lat 40`30'55", long 77`25'10", Juniata County, Hydrologic Unit 02050304, at single-span bridge on SR 3008, 2.0 mi southwest of Port Royal, and 3.5 mi upstream from mouth.
DRAINAGE AREA.--214 square miles.
PERIOD OF RECORD.--Water years October 1910 to September 1958, continuous-record; October 1981 to September 1987, low flow partial-record; October 1987 to September 1990 crest-stage partial-record; October 1991 to September 1995, miscellaneous measurements; October 1995 to September 2001, crest-stage partial record and miscellaneous measurements; October 2001 to current year, continuous record.
GAGE.--Water-stage recorder and crest-stage gage. Datum of gage is 420.47 ft above National Geodetic Vertical Datum of 1929.
COOPERATION.--Funding for the operation of this station is provided by the Pennsylvania Department of Environmental Protection.
REMARKS.--Some regulation at low and medium stages from mills upstream.
GAGE HEIGHTS OF IMPORTANCE.-
Supplied by USGS: Data transmitter operational limit - 37.2 ft;
Supplied by NWS: Flood stage-10 ft.
This station managed by the PAWSC New Cumberland Office.

Available Parameters Available Period
  
1987-11-30  2024-04-29
2007-10-01  2024-04-29


 (7)
 

  -- or --


Summary of all available data for this site
Instantaneous-data availability statement


Discharge, cubic feet per second

Most recent instantaneous value: 207 04-29-2024   13:00 EDT
Graph of  Discharge, cubic feet per second

Add up to 2 more sites and replot for "Discharge, cubic feet per second"

?


Create presentation-quality / stand-alone graph.   Subscribe to WaterAlert      

See this graph on the Monitoring Location Pages


Daily discharge, cubic feet per second -- statistics for Apr 29 based on 69 water years of record more
Min
(1946)
25th
percen-
tile
Most Recent
Instantaneous
Value Apr 29
Median 75th
percen-
tile
Mean Max
(1928)
91.0 172 207 259 465 476 3350


Gage height, feet

Most recent instantaneous value: 3.98 04-29-2024   13:00 EDT
Graph of  Gage height, feet

Add up to 2 more sites and replot for "Gage height, feet"

?


Create presentation-quality / stand-alone graph.   Subscribe to WaterAlert      

See this graph on the Monitoring Location Pages