Warning: Javascript must be enabled to use all the features on this page!


Page Loading - Please Wait...

Click to hideNews Bulletins
! This page is undergoing modernization with expected decommissioning as key features are added to the modernized pages.
Learn more about our modernization plans to find out which options will suit you best. Next Generation Monitoring Location Page is available now.

USGS 01575598 Codorus Creek near Saginaw, PA

PROVISIONAL DATA SUBJECT TO REVISION

Click to hidestation-specific text
Funding for this site is provided by:


Station gage imageSTATION.--
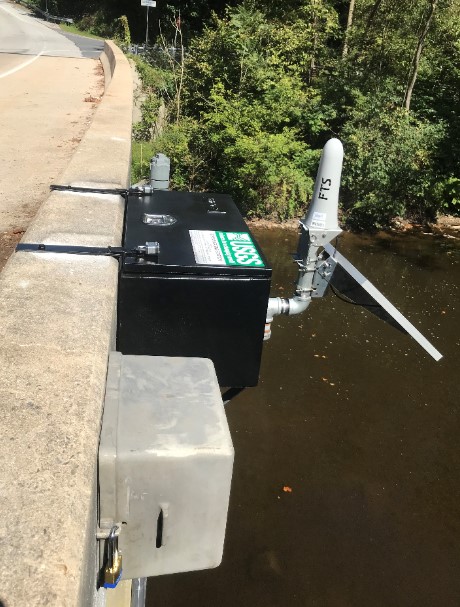
01575598 CODORUS CREEK NEAR SAGINAW, PA
LOCATION.--Lat 40`03'08", long 76`39'16", York County, Hydrologic Unit, 02050306, on downstream side of bridge on Furnace Road over Codorus Creek East Manchester Township, 0.83 mi upstream from mouth.
DRAINAGE AREA.--277 square miles.
PERIOD OF RECORD.--September 2019 to current year.
GAGE.--Water-stage recorder and crest-stage gage. Datum of gage is 253 ft above North American Vertical Datum of 1988. Satellite telemetry at station.
COOPERATION.--Station established and maintained by the U.S. Geological Survey in cooperation with the U.S. Environmental Protection Agency and the County of York.
REMARKS.--Flow regulated by Lake Marburg (01574390) Indian Rock Dam (01574700), Lake Williams and Lake Redmond; combined capacity 65,650 acre-ft. Regulation at low flow by mills and pumping station York Water Company on South Branch Codorus Creek.
Supplied by USGS-- Data transmitter operational limit - 20.0 ft.
This station managed by the PAWSC New Cumberland Office.

Available Parameters Available Period
  
2019-11-25  2024-04-26
2019-10-01  2024-04-26
2019-09-18  2024-04-26
2019-11-26  2024-04-26
2019-11-25  2024-04-26
2019-11-25  2024-04-26
2019-11-25  2024-04-26
2021-04-26  2024-04-26
2020-05-01  2024-04-26
2021-04-26  2024-04-26
2021-04-26  2024-04-26
2021-05-17  2024-04-26


 (7)
 

  -- or --


Summary of all available data for this site
Instantaneous-data availability statement


Temperature, water, degrees Celsius

Most recent instantaneous value: 14.3 04-26-2024   05:45 EDT
Graph of  Temperature, water, degrees Celsius

Add up to 2 more sites and replot for "Temperature, water, degrees Celsius"

?


Create presentation-quality / stand-alone graph.   Subscribe to WaterAlert      

See this graph on the Monitoring Location Pages


Discharge, cubic feet per second

Most recent instantaneous value: 370 04-26-2024   05:45 EDT
Graph of  Discharge, cubic feet per second

Add up to 2 more sites and replot for "Discharge, cubic feet per second"

?


Create presentation-quality / stand-alone graph.   Subscribe to WaterAlert      

See this graph on the Monitoring Location Pages


Daily discharge, cubic feet per second -- statistics for Apr 26 based on 4 water years of record more
Min
(2023)
25th
percen-
tile
Median Mean Most Recent
Instantaneous
Value Apr 26
75th
percen-
tile
Max
(2020)
156 176 284 296 370 427 459


Gage height, feet

Most recent instantaneous value: 2.35 04-26-2024   05:45 EDT
Graph of  Gage height, feet

Add up to 2 more sites and replot for "Gage height, feet"

?


Create presentation-quality / stand-alone graph.   Subscribe to WaterAlert      

See this graph on the Monitoring Location Pages


Specific conductance, water, unfiltered, microsiemens per centimeter at 25 degrees Celsius

Most recent instantaneous value: 530 04-26-2024   05:45 EDT
Graph of  Specific conductance, water, unfiltered, microsiemens per centimeter at 25 degrees Celsius

Add up to 2 more sites and replot for "Specific conductance, water, unfiltered, microsiemens per centimeter at 25 degrees Celsius"

?


Create presentation-quality / stand-alone graph.   Subscribe to WaterAlert      

See this graph on the Monitoring Location Pages


Dissolved oxygen, water, unfiltered, milligrams per liter

Most recent instantaneous value: 9.5 04-26-2024   05:45 EDT
Graph of  Dissolved oxygen, water, unfiltered, milligrams per liter

Add up to 2 more sites and replot for "Dissolved oxygen, water, unfiltered, milligrams per liter"

?


Create presentation-quality / stand-alone graph.   Subscribe to WaterAlert      

See this graph on the Monitoring Location Pages


pH, water, unfiltered, field, standard units

Most recent instantaneous value: 8.0 04-26-2024   05:45 EDT
Graph of  pH, water, unfiltered, field, standard units

Add up to 2 more sites and replot for "pH, water, unfiltered, field, standard units"

?


Create presentation-quality / stand-alone graph.   Subscribe to WaterAlert      

See this graph on the Monitoring Location Pages


Turbidity, water, unfiltered, monochrome near infra-red LED light, 780-900 nm, detection angle 90 +-2.5 degrees, formazin nephelometric units (FNU)

Most recent instantaneous value: 7.9 04-26-2024   05:45 EDT
Graph of  Turbidity, water, unfiltered, monochrome near infra-red LED light, 780-900 nm, detection angle 90 +-2.5 degrees, formazin nephelometric units (FNU)

Add up to 2 more sites and replot for "Turbidity, water, unfiltered, monochrome near infra-red LED light, 780-900 nm, detection angle 90 +-2.5 degrees, formazin nephelometric units (FNU)"

?


Create presentation-quality / stand-alone graph.   Subscribe to WaterAlert      

See this graph on the Monitoring Location Pages


Suspended sediment load, water, unfiltered, computed, the product of regression-computed suspended sediment concentration and streamflow, short tons per day

Most recent instantaneous value: 16.2 04-26-2024   05:45 EDT
Graph of  Suspended sediment load, water, unfiltered, computed, the product of regression-computed suspended sediment concentration and streamflow, short tons per day

Add up to 2 more sites and replot for "Suspended sediment load, water, unfiltered, computed, the product of regression-computed suspended sediment concentration and streamflow, short tons per day"

?


Create presentation-quality / stand-alone graph.   Subscribe to WaterAlert      

See this graph on the Monitoring Location Pages


Nitrate plus nitrite, water, in situ, milligrams per liter as nitrogen, [Qualified]

Most recent instantaneous value: 4.5 04-26-2024   05:45 EDT
Graph of  Nitrate plus nitrite, water, in situ, milligrams per liter as nitrogen, [Qualified]

Add up to 2 more sites and replot for "Nitrate plus nitrite, water, in situ, milligrams per liter as nitrogen, [Qualified]"

?


Create presentation-quality / stand-alone graph.   Subscribe to WaterAlert      

See this graph on the Monitoring Location Pages


Suspended sediment concentration, water, unfiltered, estimated by regression equation, milligrams per liter

Most recent instantaneous value: 16.2 04-26-2024   05:45 EDT
Graph of  Suspended sediment concentration, water, unfiltered, estimated by regression equation, milligrams per liter

Add up to 2 more sites and replot for "Suspended sediment concentration, water, unfiltered, estimated by regression equation, milligrams per liter"

?


Create presentation-quality / stand-alone graph.   Subscribe to WaterAlert      

See this graph on the Monitoring Location Pages


Phosphorus, water, unfiltered, estimated by regression equation, milligrams per liter as phosphorus

Most recent instantaneous value: 0.13 04-26-2024   05:45 EDT
Graph of  Phosphorus, water, unfiltered, estimated by regression equation, milligrams per liter as phosphorus

Add up to 2 more sites and replot for "Phosphorus, water, unfiltered, estimated by regression equation, milligrams per liter as phosphorus"

?


Create presentation-quality / stand-alone graph.   Subscribe to WaterAlert      

See this graph on the Monitoring Location Pages


Total nitrogen [nitrate + nitrite + ammonia + organic-N], water, unfiltered, estimated by regression equation, milligrams per liter as nitrogen

Most recent instantaneous value: 3.4 04-26-2024   05:45 EDT
Graph of  Total nitrogen [nitrate + nitrite + ammonia + organic-N], water, unfiltered, estimated by regression equation, milligrams per liter as nitrogen

Add up to 2 more sites and replot for "Total nitrogen [nitrate + nitrite + ammonia + organic-N], water, unfiltered, estimated by regression equation, milligrams per liter as nitrogen"

?


Create presentation-quality / stand-alone graph.   Subscribe to WaterAlert      

See this graph on the Monitoring Location Pages